Narzędzia użytkownika
Narzędzia witryny
Pasek boczny
en:statpqpl:porown3grpl:nparpl:skillings_mpl
The Skillings-Mack ANOVA (missing data)
The analysis of variance of repeated measures for Skillings-Mack ranks was proposed by Skillings and Mack in 1981 1). t is a test that can be used when there are missing data, but the missing data need not occur in any particular setting. However, each site must have at least two observations. If there are no tied ranks and no gaps are present it is the same as the Friedman's ANOVA, and if data gaps are present in a balanced arrangement it corresponds to the results of Durbin's ANOVA.
Basic assumptions: Basic assumptions:
- measurement on an ordinal scale or on an interval scale,
Hypotheses relate to the equality of the sum of ranks for successive measurements ( ) or are simplified to medians (
 )
)

The test statistic has the form:

where:

 ,
,
 – number of observations for
  -th object,
 – ranks assigned to successive measurements (
 ), separately for each study object (
 ), with ranks for missing data equal to the average rank for the object,
 – matrix determining the covariances for
  at the truth of
  2).
2).
When each pair of measurements occurs simultaneously for at least one observation, this statistic has asymptotically (for large sample sizes) the Chi-square distribution with  degrees of freedom.
The p-value, designated on the basis of the test statistic, is compared with the significance level  :
:

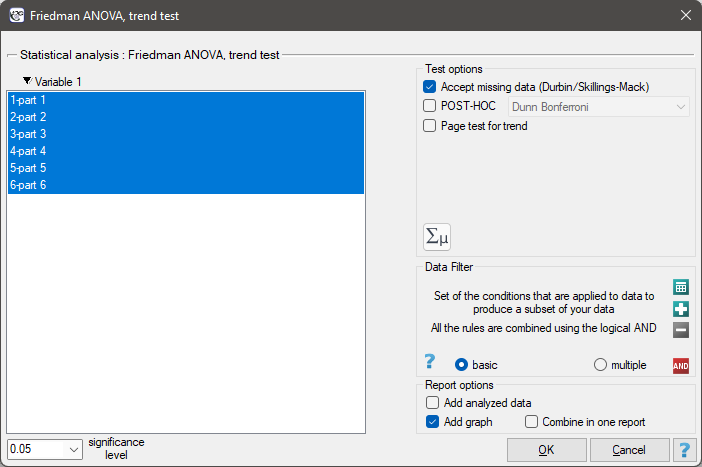
The settings window with the Skillings-Mack ANOVA can be opened in Statistics menu→NonParametric tests →Friedman ANOVA, trend test or in ''Wizard''
Note
For records with missing data to be taken into account, you must check the Accept missing data option. Empty cells and cells with non-numeric values are treated as missing data. Only records containing more than one numeric value will be analyzed.
A certain university teacher, wanting to improve the way he conducted his classes, decided to verify his teaching skills. In several randomly selected student groups, during the last class, he asked them to fill in a short anonymous questionnaire. The survey consisted of six questions about how the six specified parts of the material were illustrated. The students could rate it on a 5-point scale, where 1 - the way of presenting the material was completely incomprehensible, 5 - a very clear and interesting way of illustrating the material. The data obtained in this way turned out to be incomplete due to the fact that students did not answer questions about the part of the material they were absent on. In the 30-person group completing the survey, only 15 students provided complete responses. Performing an analysis that does not account for data gaps (in this case, a Friedman analysis) will have limited power by cutting the group size so drastically and will not lead to the detection of significant differences. Data gaps were not planned for and are not present in the balanced block, so this task cannot be performed using Durbin's analysis along with his POST-HOC test.
Hypotheses:

The results of the ANOVA Skillings-Mack analysis are presented in the following report:
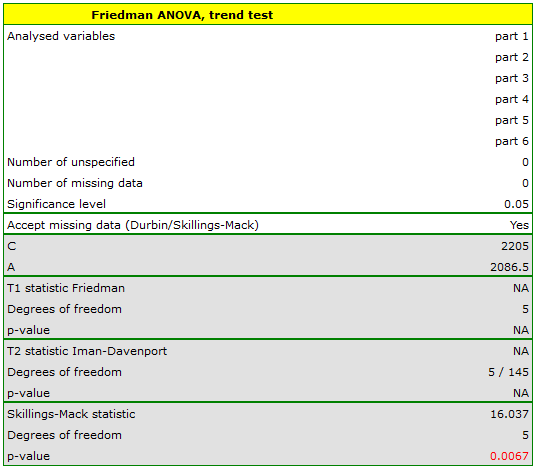
The  value obtained should be treated with caution due to possible tied ranks. However, for this study, the p=0.0067 is well below the accepted significance level of
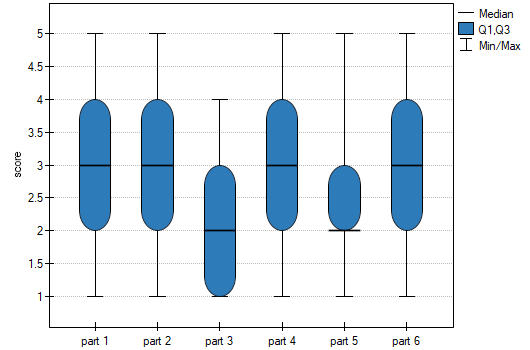
  , indicating that significant differences exist. The differences in responses can be observed in the graph; however, there is no POST-HOC analysis available for this test.
en/statpqpl/porown3grpl/nparpl/skillings_mpl.txt · ostatnio zmienione: 2022/02/13 17:19 przez admin
Narzędzia strony
Wszystkie treści w tym wiki, którym nie przyporządkowano licencji, podlegają licencji: CC Attribution-Noncommercial-Share Alike 4.0 International
