Narzędzia użytkownika
Narzędzia witryny
Pasek boczny
en:statpqpl:rzetelnpl
Reliability analysis
Reliability analysis is usually associated with the complex scale construction, in particular summary scales (these consist of many individual items). Reliability analysis, associated as its internal consistency, informs us to what extent a particular scale measures what it should measure. In other words, to what extend the scale items measure the things that are measured by the whole scale
When every scale item measures the same construct (the correlation between the items should be high) we can call it reliable scale. This assumption can be checked by calculating the matrix of the Pearson's correlation coefficient. Many measures of concordance can be used in reliability analysis. However, the most popular technique is the  -Cronbach coefficient and so-called split-half reliability.
Cronbach's alpha and split-half reliability
Cronbach's coefficient was named for the first time in 19511), by Cronbach. It measures the proportion of single item variances a and the whole scale variance (items sum). It is calculated according to the following formula:

where:
 – number of scale items,
 – variance of
  item,
item,
 – variance of items sum.
Standardised reliability coefficient  is calculated according to the following formula:

where:
 – mean of all the Pearson's correlation coefficients for (
 ) scale items.
Alpha can take on any value less than or equal to 1, including negative values, although only positive values make sense. If all scale items are reliable, the reliability coefficient is 1.
There are some values that help in an assessesment of particular scale items usefulness:
- the value of
 coefficient calculated after removing a particular scale item,
 - the value of standard deviation of a scale calculated after removing a particular scale item,
- mean value of a scale calculated after removing a particular scale item,
- the Pearson's correlation coefficients between a particular item and the sum of other items.
Split-half reliability is a random scale item division into 2 halves and an analysis of the halves correlation. It is carried out by the Spearman-Brown split-half reliability coefficient, published independently by Spearman (1910)2) and Brown (1910)3):

where:
 – the Pearson's correlation coefficient between halves of a scale.
If two halves, randomly selected, are ideally correlated:  .
.
A formula for the split-half reliability coefficient proposed by Guttman (1945)4):

where:
 ,
,  – variance of the first and the second half of a scale,
– variance of the sum of all scales items.
Note
The scale is realiable if the scales reliability coefficients (, ,  ,
,  ) are larger than 0.6 and smaller than 1.
Standard error of measurement is calculated for the reliable scale, according to the following formula:

or

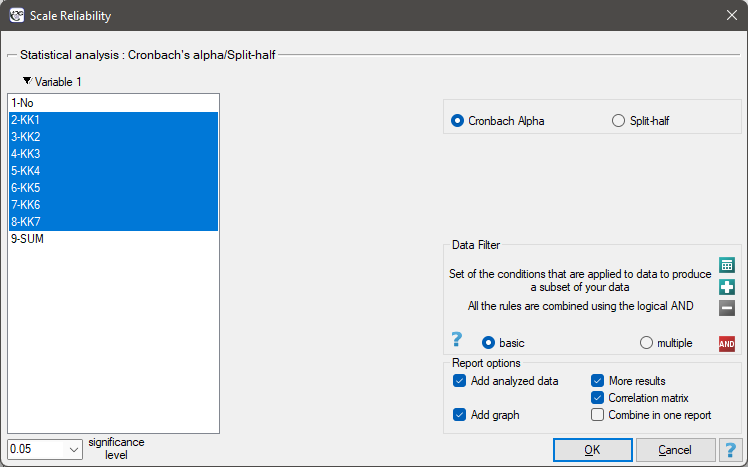
The settings window with the Cronbach's alpha/Split-half can be opened in Statistics menu →Scale reliability.
A „competence scale”, created in some company, enables an assessment of the usefulness of future employees. Apart from participation in a job interview, candidates fill in the questionnaire that includes the „competence scale” questions. There are 7 questions in the scale. For each question, one can get 1 - 5 points, where 1 - the lowest mark, 5 - the highest mark. The maximum score of the questionnaire is 35. In the table, there are scores obtained by 24 candidates.

For checking the accuracy of the „competence scale”, the reliability should be analysed.
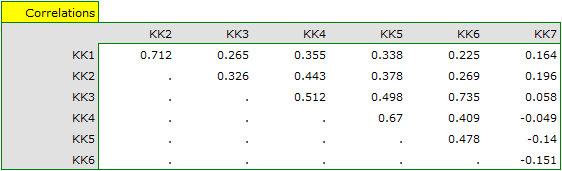
The correlation matrix indicates that the last item is least correlated with the other items. Thus, it is suspected that the item does not measure the same construct as the others.
The competence scale turned out to be a reliable scale. Cronbach alpha coefficient is 0.7368, and mean of all the Pearson's correlation coefficients is 0.3185.
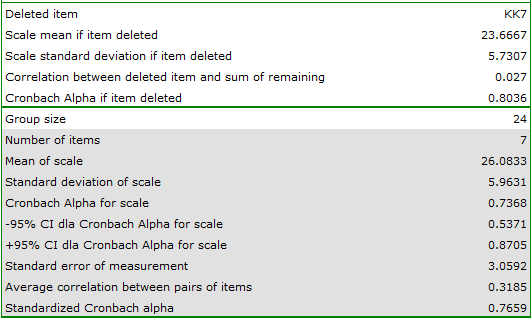
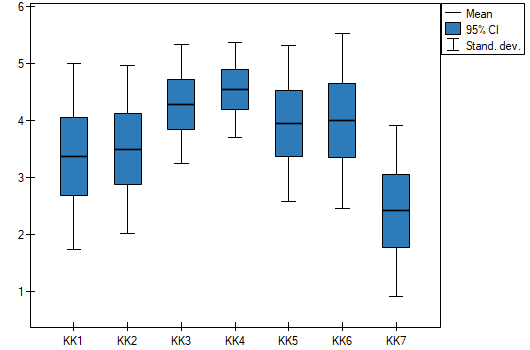
A more precised analysis of each item indicates that, except the last one, they all influence scale reliability in a similar way. Correlation between the KK7 item and the other scales items, is the weakest: 0.0270. Removing the KK7 item from the scale, the Cronbach alpha coefficient would increase to 0.8036.
Similar conclusion can be drawn on the basis of split-half reliability analysis, carried out on the items randomly divided into 2 halves (KK1, KK3, KK5) (KK2, KK4, KK6, KK7).
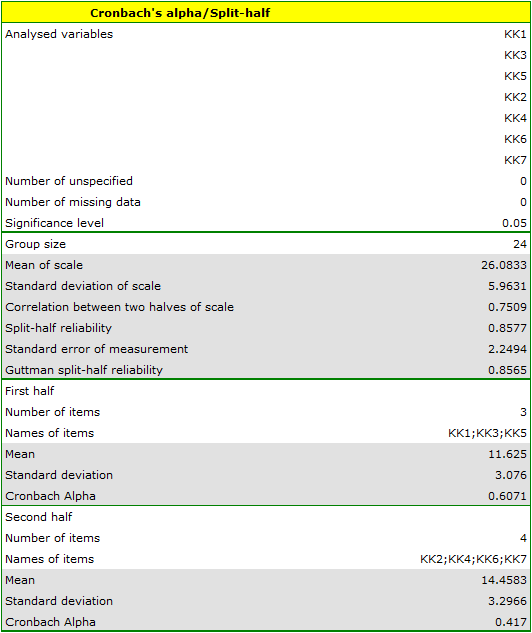
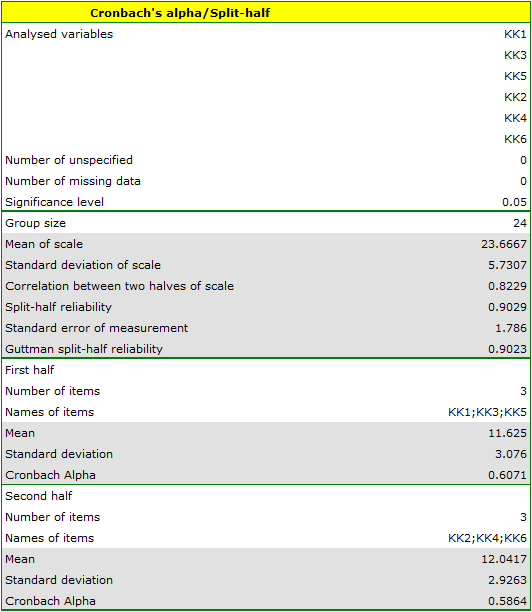
Spearman-Brown split-half reliability Coefficient is 0.8578. Guttman split-half reliability coefficient is 0.8565. The halves are well correlated – the correlation coefficient is 0.7509. However, the value of Cronbach alpha coefficient is too low for the second half (0.416958). This half includes the KK7 item, which shows a weak correlation with the other scale items. Removing the item and repeating the analysis, all the items are really high and reliable.
1)
Cronbach L.J. (1951), Coefficient alpha and the internal structure of tests. Psychometrika, 16(3),
297-334
2)
Spearman C. (1910), Correlation calculated from faulty data. British Journal of Psychology, 3, 271-295
3)
Brown W. (1910), Some experimental results in the correlation of mental abilities. British Journal of Psychology, 3, 296-322
4)
Guttman L. (1945), A basic for analyzing test-retest reliabilit. Psychometrika, 10, 255-282
en/statpqpl/rzetelnpl.txt · ostatnio zmienione: 2022/02/16 10:41 przez admin
Narzędzia strony
Wszystkie treści w tym wiki, którym nie przyporządkowano licencji, podlegają licencji: CC Attribution-Noncommercial-Share Alike 4.0 International
