Narzędzia użytkownika
Narzędzia witryny
Pasek boczny
en:statpqpl:kreatorpl
Spis treści
With Teacher
The wizard
The Wizard is a tool which makes the navigation easier to go, through the basic statistics included in an application, especially for a novice user. It includes suggestions of assumptions which should be checked before the choice of a particular statistic test. The last step of the wizard is to select an appropriate statistic test and to open the window with the settings of the test options.
The Wizard may be launched by:
- Statistics→Wizard,
-  button on a toolbar.
A launched wizard window includes the possibility to choose the kind of an analysis that a user wants to carry out. A user may choose:
- Comparison - 1 group - to compare values of measurements coming from a 1 population with the specific value given by the user. This population is represented by raw data gathered in a 1 column or cumulated to the form of a frequency table.
- Comparison - 2 groups - to compare values of measurements coming from 2 populations. These populations are represented by raw data gathered in 2 columns or cumulated to the form of a contingency table.
- Comparison - more than 2 groups - to compare values of measurements coming from several populations. The populations are represented by data collected in the form of raw data, in several columns.
- Correlation - to check the occurrence of dependence between 2 parameters coming from a 1 population. These features are represented by raw data gathered in 2 columns or cumulated to the form of a contingency table.
- Agreement - to check the concordance of obtained measurements. These features are represented by raw data gathered in several columns or cumulated to the form of a contingency table.
When the user chooses the kind of an analysis, a graph will occur. The graph is divided according to a scale, on which the measurement of the analysed features was done (interval scale, ordinal scale, nominal scale).
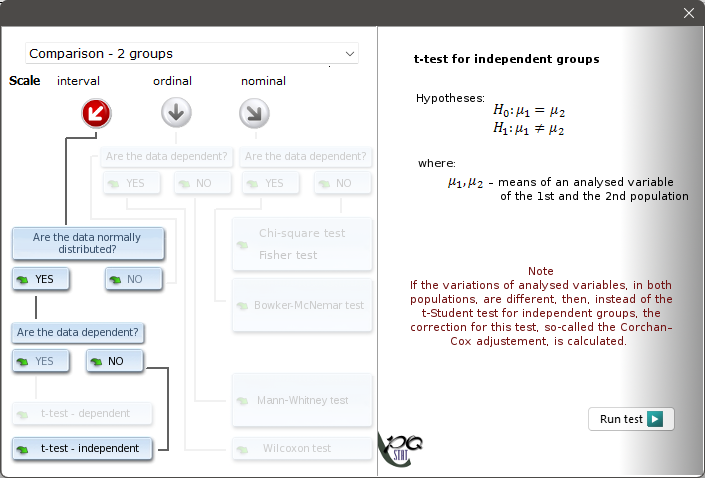
The user moves on the graph by selecting the adequate answers to the asked questions. After the user gets through the way on the graph, chosen by himself, he is able to perform this test, which  according to the replies is an appropriate one to solve the determined statistical problem.
Test summaries
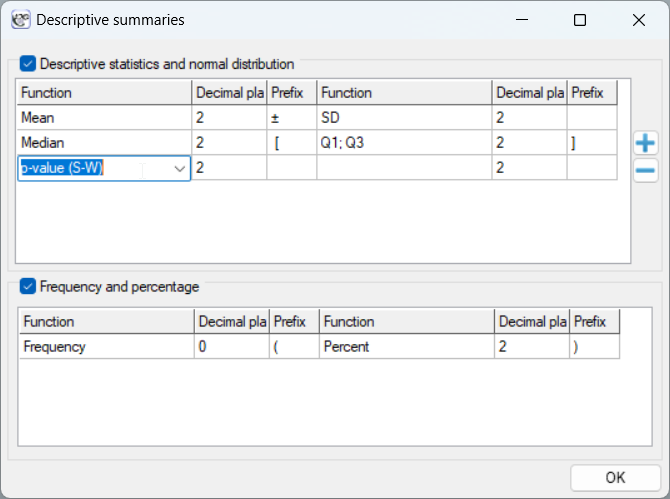
To speed up the work, we can perform individual tests in sets. The quantitative data will be able to be further described by means, medians, etc., and the qualitative data by counts and percentages.
The settings window with the Test summaries can be opened in Stistics→Summaries→Test summaries and then the selected group of analyses.
At our disposal we have:
- Comparison of two dependent groups:
- Normality of distribution test Kołmogorov-Smirnov (or another one suggested by the user)
- and others …
- Comparison of two independent groups:
- Normality of distribution test Kołmogorov-Smirnov (or another one suggested by the user)
- and others …
- Korelację:
- Normality of distribution test Kołmogorov-Smirnov (or another one suggested by the user)
- and others …
In the program, for each of the analyzed variables, depending on whether they are quantitative or qualitative, we can return results:
- selected tests - automatically according to the rule described below returned in the table report;
- all tests and accompanying coefficients and measures regardless of whether the minimum conditions for their use are met.
Notes on the program's automatic test selection
Note 1!
If the user does not describe each variable with the appropriate scales before analysis, the quantitative data will be treated as an interval scale, and the qualitative data as a nominal scale.
Note 2!
Testing the normality of the distribution is based on the results of the normality test selected by the user when setting the descriptive statistics.
Note 3!
If the user chooses not to indicate tests that assess the normality of the distribution in the window of these statistics, then it will be checked based on the Kolmogorov-Smirnov test. The analyses we propose are robust to small deviations from the normal distribution, and the Kolmogorov-Smirnov test is the most conservative among the available tests, by which we show the non-normality of the distribution only when the tested distribution differs greatly from the normal distribution. In this situation, we test the normality of the distribution (1) for the comparison of two independent groups based on the data in each group, (2) for the comparison of two dependent groups based on the difference in measurements, (3) for correlation based on the model residuals.
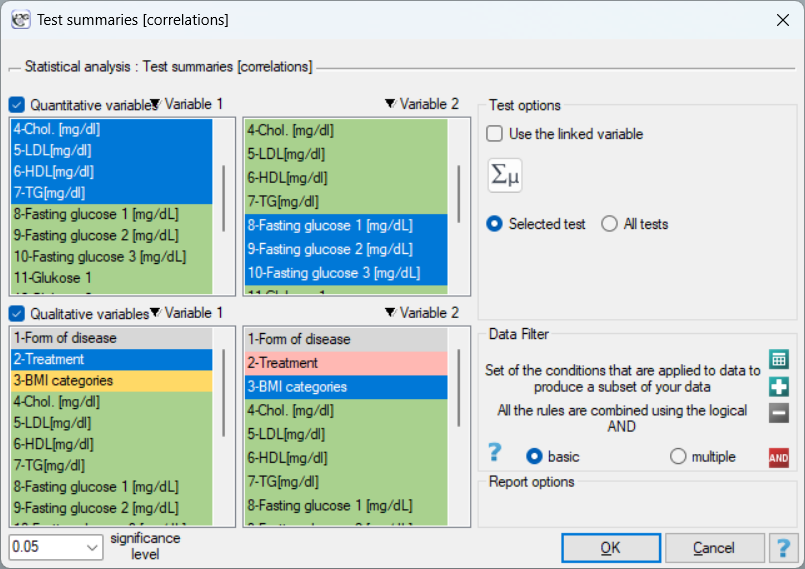
We want to make an automatic comparison between two independent groups: chronic patients and acute patients. We make the comparison based on the data described on the interval scale: Chol, LDL, HDL, TG, based on the ordinal feature BMI, and nominal data: Treatment, Estradiol 1, Estradiol 2, Estradiol 3.
To do this, we choose the menu Summaries → Test summaries [two independent groups] and select the grouping variable: Treatment, then we select interval data (in the quantitative variables section) and nominal and ordinal data (in the qualitative variables section). We select the option Selected test and perform the analysis.
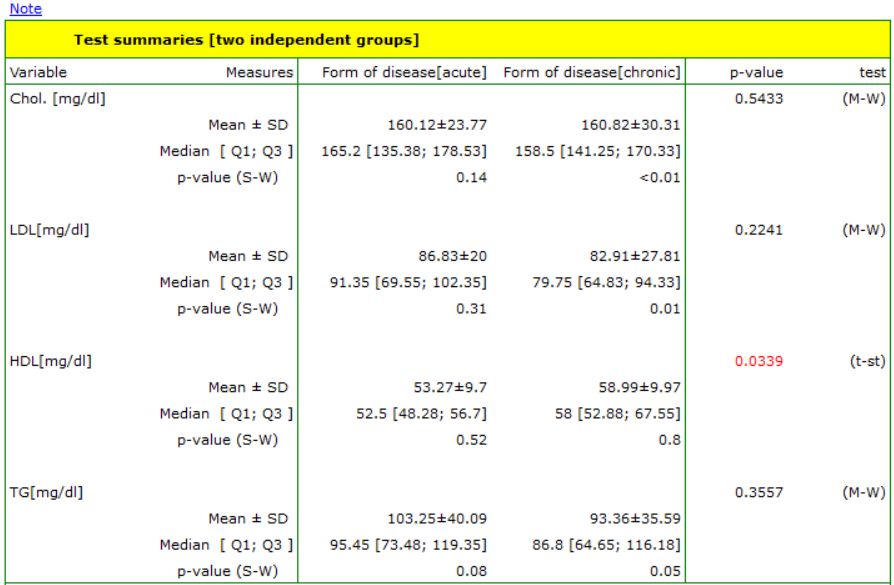
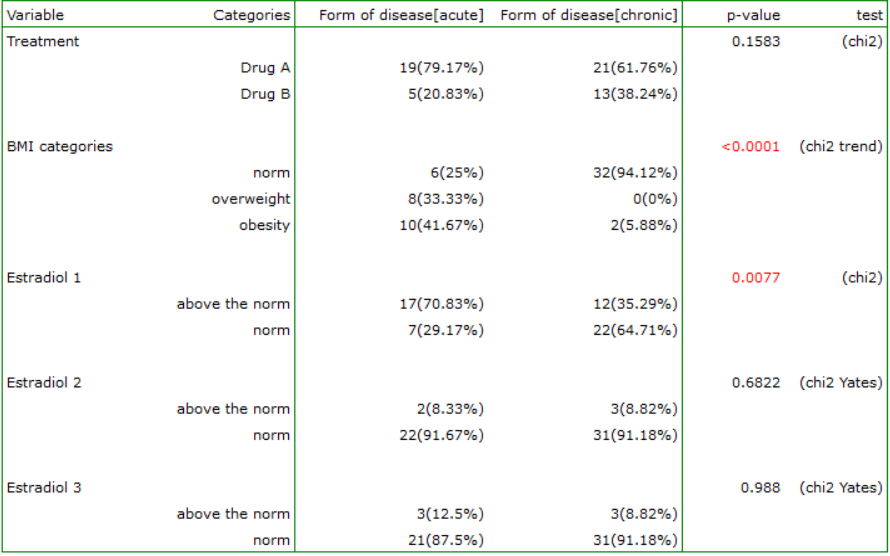
The result is both a description of each group and the statistical test selected for comparison.
In the Note at the top of the report, there is a description informing the principle of selecting a statistical test suitable for the analysis:
„Quantitative variables:
For the interval scale with normality of distribution, the unpaired Student's t-test (t-st) or its Cochran-Cox correction (C-C) was determined when the variances of the groups differed. For the interval scale, when the condition of normality of distribution was not met, as for the ordinal scale, the Mann-Whitney (M-W) test was determined. Normality of the data was tested with the Shapiro-Wilk and equality of variance was tested with the Fisher-Snedecor (F-S) test. If the scale was not marked for the analyzed variables, it was assumed that the data came from the interval scale.
Qualitative variables:
For the nominal scale, the chi-square test (chi2) was determined, and when Cochran's condition was not met the Fisher exact test (Fisher exact) or, for 2×2 tables with a sample size greater than 40, the Yates correction (chi2-Yates) was determined For ordinal scale, the chi-square test for trend was determined. If the scale was not marked for the variables analyzed, it was assumed that the data came from the nominal scale.”
en/statpqpl/kreatorpl.txt · ostatnio zmienione: 2023/06/04 16:54 przez admin
Narzędzia strony
Wszystkie treści w tym wiki, którym nie przyporządkowano licencji, podlegają licencji: CC Attribution-Noncommercial-Share Alike 4.0 International
