Narzędzia użytkownika
Narzędzia witryny
Pasek boczny
en:przestrzenpl:menmappl
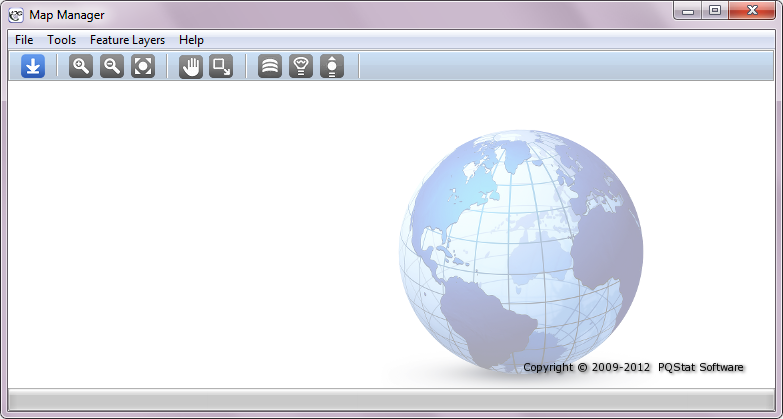
Map manager
The Map Manager is a tool for managing a map and the layers ascribed to the map. It is possible to view both maps imported to the PQStat program and maps opened directly from an SHP file.
The Map Manager is activated through the:
- menu Spacial analysis→Map Manager,
- button  on the tool bar,
- context menu Map Manager on the name of a datasheet linked to the map.
A map can be opened with the help of the Map Manager:
- menu File→Open file… \textendash if we open a map from a shapefile (SHP),
- menu Plik→Project maps or button  on the tool bar \textendash if we open a map from the PQStat program,
or in the Navigation tree of the PQStat program:
- context menu Map Manager on the name of the datasheet linked to the map.
The image which presents a map can be exported to a file in the BMP, PNG, or JPG format, by choosing, in the Map Manager window:
- menu File→Export view….
Map Viewing Tools
Zoom in  – allows to view a map in a larger scale and see its details;
Zoom out  – allows to view a map in a smaller scale and see all its parts;
Adjust to the window  – allows such a view of a map that the whole image is displayed in a window;
Select  – allows to choose a rectangular part of a map, which will be enlarged and adjusted to the window size;
Grabber  – allows to move the image in the browser window so as to place a given part of the image in a chosen position.
As we are browsing the map we also get a tooltip concerning the ID and the name of the object we point to with the cursor. The name is loaded from the data sheet, it is the variable indicated as active in the Map manager. By default, during import the first variable of the text type is set as active.
We can get more information about the object pointed at by choosing the option Identify from the context menu. In the identification window it is also possible to Activate/Deactivate object.
Selection Area Tools
Creating and saving a selection area allows to choose parts of a map which can later be subjected to a separate analysis.
- Creating a Selection Area
To select and save a selected area we choose Tools→Create selection area. Then, using the mouse or filling in the fields in the upper part of the Map Manager window, we select the chosen part of a map (elliptical or rectangular shape). The selection is saved with the use of the button Save.
- Edition of a Selection Area
The placement of each selection area which was saved can be changed. In the edition window we can also delete a selection area.
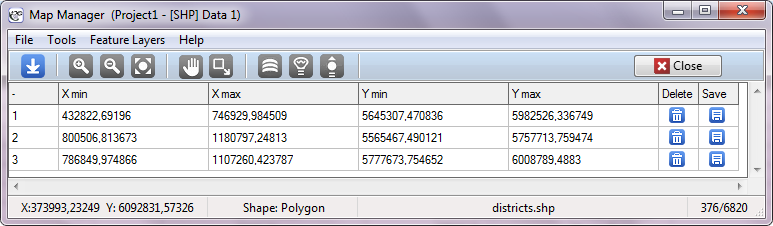
That window is opened with the help of the menu Tools→Edit selection area, and closed with the use of the button Close.
- Deleting All Selection Areas
All selection areas can be deleted with the use of the menu Tools→Delete all selection areas.
Layers
Both a map and elements added to it form layers. Layers are organized so that they only contain information about objects of one type. The use of layered organization enables easy modification of only selected objects.
The basic layer is the base layer containing a map. We can add new elements to that layer by creating new layers.
- Adding Layers – to draw objects on subsequent layers choose the menu
Feature Layers→Add Layer. - Layer – Result of statistical analysis
It is a layer created together with a report on the statistical spatial analysis. It presents the result of the statistical analysis, appended to the report. The information about the existence of layers one can draw on the map can be found at the bottom of the report (the button  ). The layer can also be added with the button
  in the Map Manager window.
As long as there are no reports on statistical spatial analysis, the option window for analysis results is empty. When there are such reports the option window contains a list of layers. The names of the layers on the list consist of the name of the report from which a layer comes, together with the date and hour the report was created, and a description of the type of objects drawn there.
- Layer –View of another map
That is a layer which presents a map related to another datasheet (the button  in the Map Manager window). The map view can be a single layer or it can consist of a number of layers. It cannot be edited directly. The change of the look of the view is only possible when particular layers forming that view and placed in a real location (i.e. linked to another datasheet) are edited.
As long as there is only one datasheet related to a map in the project, the option window of another map is empty. When there are several datasheets the option window contains a list of layers. The names of the layers on the list comprise the number and name of the datasheet linked to the map and the name of the file from which the map was imported.
If the map is appended with a map view from another datasheet in such a way that a circular reference is made (e.g. map 2 is assigned a view of map 1, and map 1 is assigned a view of map 2), then a message is displayed about a circular reference. The reference will be managed but circular references are not advised.
- Layer – Centroid of a polygon – that is a layer of the point type.
A centroid of a polygon is a point lying within a polygon and representing the center of mass (O'Rourke J (1998)1)).
Centroids can be drawn on the basis of calculations made on the map – in such a case we choose the option Draw and calculate based on map data, or on the basis of existing points the coordinates of which are in the datasheet – we then choose the option Draw based on the datasheet.
- Layer – Center of a polygon – that is a layer of the point type.
A center is a point with coordinates of the X axis and the Y axis calculated as a mean from the coordinates of points constituting polygon vertices.
Centers can be drawn on the basis of calculations made on the map – in such a case we choose the option Draw and calculate based on map data, or on the basis of existing points the coordinates of which are in the datasheet – we then choose the option Draw based on the datasheet.
- Layer – Label for an object – that is a layer of the text type.
A label is any text or number concerning objects presented on a map. Objects can be described by choosing from the datasheet a variable which contains proper labels.
- Layer – Bounding types – that is a layer of the polygonal type.
Min. Bounding - convex hull –that is the smallest convex polygon in which analysed objects are enclosed (Yamamoto J.K. 1997 2));
Min. Bounding - rectangle – that is the smallest rectangle in which analysed objects are enclosed;
Min. Bounding - circle – that is the smallest circle in which analysed objects are enclosed;
Rectangle from map bounding – that is a rectangle in which analysed objects are enclosed, with coordinates of the lower left-hand vertex = ( ,
,  ) and of the upper right-hand vertex = (
 ,
,  ).
).
- Layer List – the layer list allows to check how many visible layers constitute the received image (button
 on the tool bar).
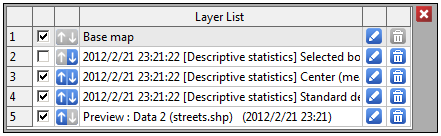
The list also allows switching on and off visibility of a layer and changing the order in which layers are added  , editing the layers
  , and deleting them
  . If the source of a layer (a report or a map linked to the layer) is removed then such a layer is automatically removed from the layer list.
Map Style Edition
We can edit map layers by choosing the button in the map list. The manner of editing depends on the type of objects presented on a given map (points, multipoints, lines, polygons). It is possible to select the style of lines, color fill, and the level of its transparency. By default the coloring utilizes one color only. In the case of layers representing the base map there is a number of coloring methods.
Coloring Methods:
- Full color – when this method is used, all objects will be colored with the use of the same method – with the use of one color only (the button
Fill). - Color gradation – when this method is used, objects will be colored according to the value assigned to them in a selected datasheet variable (the button
Color gradation). For example, when coloring a map which shows altitude, color shade for points lying higher will be different from that for points lying lower. The variable according to which we will do the coloring should only contain numerical values. If that is not the case then the object for which there is no numerical value is not colored according to the coloring method chosen for that variable but has the default color for the map.
Methods for variable breaks used in color gradation:
- Natural Breaks (Jenks) –a method in which a variable is broken into such classes that variance in classes is minimized and variance among classes is maximized.
- Quantile Breaks – a method in which a variable is broken into classes with an equal number of units.
en/przestrzenpl/menmappl.txt · ostatnio zmienione: 2022/02/16 11:41 przez admin
Narzędzia strony
Wszystkie treści w tym wiki, którym nie przyporządkowano licencji, podlegają licencji: CC Attribution-Noncommercial-Share Alike 4.0 International
