Narzędzia użytkownika
Narzędzia witryny
Pasek boczny
en:statpqpl:kreatorpl:kreatpl
The wizard
The Wizard is a tool which makes the navigation easier to go, through the basic statistics included in an application, especially for a novice user. It includes suggestions of assumptions which should be checked before the choice of a particular statistic test. The last step of the wizard is to select an appropriate statistic test and to open the window with the settings of the test options.
The Wizard may be launched by:
- Statistics→Wizard,
-  button on a toolbar.
A launched wizard window includes the possibility to choose the kind of an analysis that a user wants to carry out. A user may choose:
- Comparison - 1 group - to compare values of measurements coming from a 1 population with the specific value given by the user. This population is represented by raw data gathered in a 1 column or cumulated to the form of a frequency table.
- Comparison - 2 groups - to compare values of measurements coming from 2 populations. These populations are represented by raw data gathered in 2 columns or cumulated to the form of a contingency table.
- Comparison - more than 2 groups - to compare values of measurements coming from several populations. The populations are represented by data collected in the form of raw data, in several columns.
- Correlation - to check the occurrence of dependence between 2 parameters coming from a 1 population. These features are represented by raw data gathered in 2 columns or cumulated to the form of a contingency table.
- Agreement - to check the concordance of obtained measurements. These features are represented by raw data gathered in several columns or cumulated to the form of a contingency table.
When the user chooses the kind of an analysis, a graph will occur. The graph is divided according to a scale, on which the measurement of the analysed features was done (interval scale, ordinal scale, nominal scale).
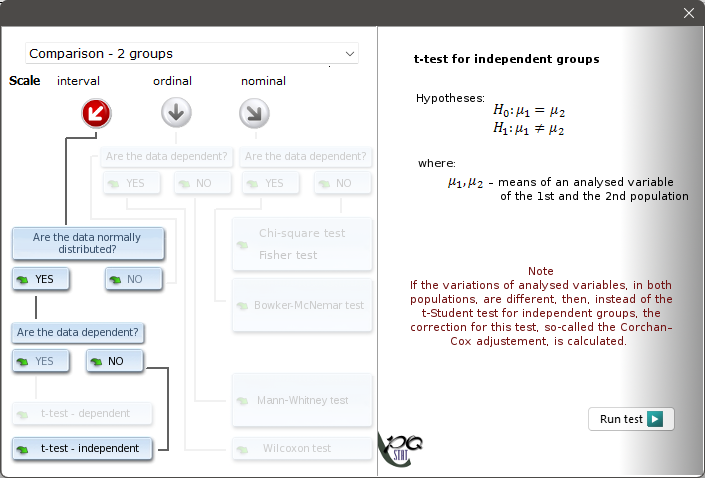
The user moves on the graph by selecting the adequate answers to the asked questions. After the user gets through the way on the graph, chosen by himself, he is able to perform this test, which  according to the replies is an appropriate one to solve the determined statistical problem.
en/statpqpl/kreatorpl/kreatpl.txt · ostatnio zmienione: 2023/04/01 15:55 przez admin
Narzędzia strony
Wszystkie treści w tym wiki, którym nie przyporządkowano licencji, podlegają licencji: CC Attribution-Noncommercial-Share Alike 4.0 International
