Narzędzia użytkownika
Narzędzia witryny
Pasek boczny
en:statpqpl:porown3grpl:nparpl:conovervar
The Conover ranks test of variance
Conover squared ranks test is used, similarly to Fisher-Snedecor test (for  ), Levene test and Brown-Forsythe test (for
  ) to verify the hypothesis of similar variation of the tested variable in several populations. It is the non-parametric counterpart of the tests indicated above, by that it does not assume normality of the data distribution and is based on the ranks1).However, this test examines variation and therefore distances to the mean, so the basic condition for its use is:
- measurement on an interval scale,
Hypotheses:

The test statistic has the form:

where:
 ,
,
 – individual group sizes,
 –sum of ranks squares in
  -th group,
 – mean of all ranks squares,
 ,
,
 – ranks for values representing the distance of the measurement from the mean of a given group.
This statistic has a Chi-squaredistribution with  degrees of freedom.
The p-value, designated on the basis of the test statistic, is compared with the significance level  :
:

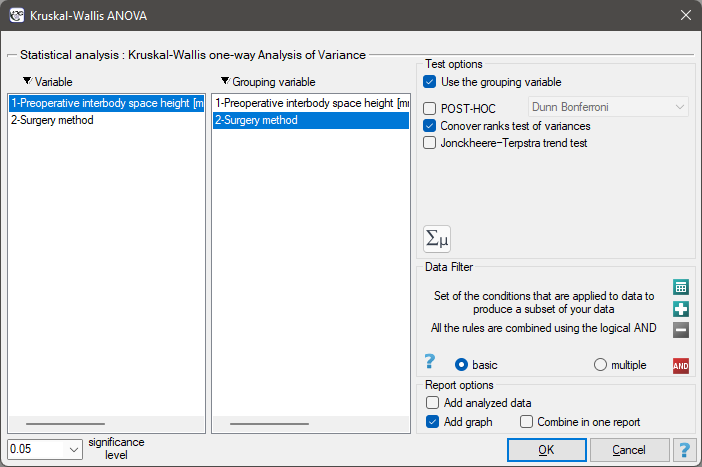
The settings window with the Conover ranks test of variance can be opened in Statistics menu→NonParametric tests→Kruskal-Wallis ANOVA, option Conover ranks test of variance or textsf{Statistics} menu→NonParametric tests→Mann-Whitney, option Conover ranks test of variance.
EXAMPLE(surgeryMethod.pqs file)
Patients have been prepared for spinal surgery. The patients will be operated on by one of three methods. Preliminary allocation of each patient to each type of surgery has been made. At a later stage we intend to compare the condition of the patients after the surgeries, therefore we want the groups of patients to be comparable. They should be similar in terms of the height of the interbody space (WPMT) before surgery. The similarity should concern not only the average values but also the differentiation of the groups.
The distribution of the data was checked
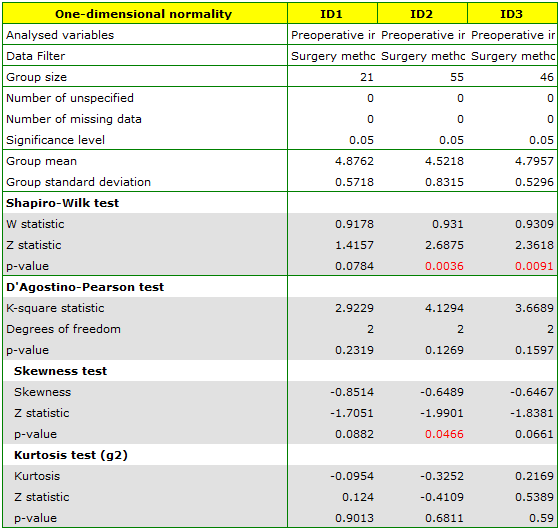
It is found that for the two methods, the WPMT operation exhibits deviations from normality, largely caused by skewness of the data. Further comparative analysis will be conducted using the Kruskal-Wallis test to compare whether the level of WPMT differs between the methods, and the Conover test to indicate whether the spread of WPMT scores is similar in each method.
Hypotheses for Conover's variance test:

Hypotheses for Kruskal-Wallis test:

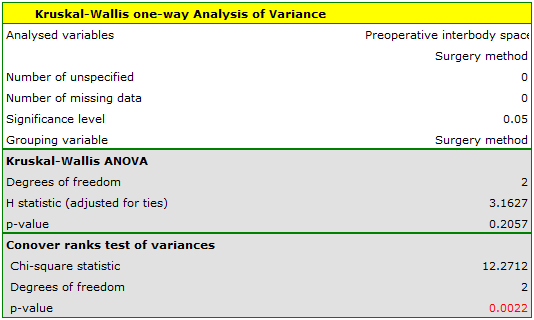
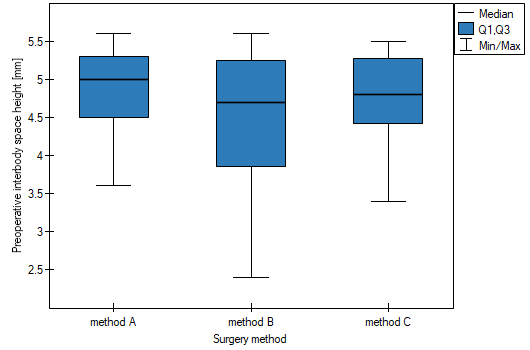
First, the value of Conover's test of variance is interpreted, which indicates statistically significant differences in the ranges of the groups compared (p=0.0022). From the graph, we can conclude that the differences are mainly in group 3. Since differences in WPMT were detected, the interpretation of the result of the Kruskal-Wallis test comparing the level of WPMT for these methods should be cautious, since this test is sensitive to heterogeneity of variance. Although the Kruskal-Wallis test showed no significant differences (p=0.2057), it is recommended that patients with low WPMT (who were mainly assigned to surgery with method B) be more evenly distributed, i.e. to see if they could be offered surgery with method A or C. After reassignment of patients, the analysis should be repeated.
1)
Conover W. J. (1999), Practical nonparametric statistics (3rd ed). John Wiley and Sons, New York
en/statpqpl/porown3grpl/nparpl/conovervar.txt · ostatnio zmienione: 2022/02/13 16:20 przez admin
Narzędzia strony
Wszystkie treści w tym wiki, którym nie przyporządkowano licencji, podlegają licencji: CC Attribution-Noncommercial-Share Alike 4.0 International
