Narzędzia użytkownika
Narzędzia witryny
Pasek boczny
en:statpqpl:wielowympl:porownpl
Comparison of multiple linear regression models
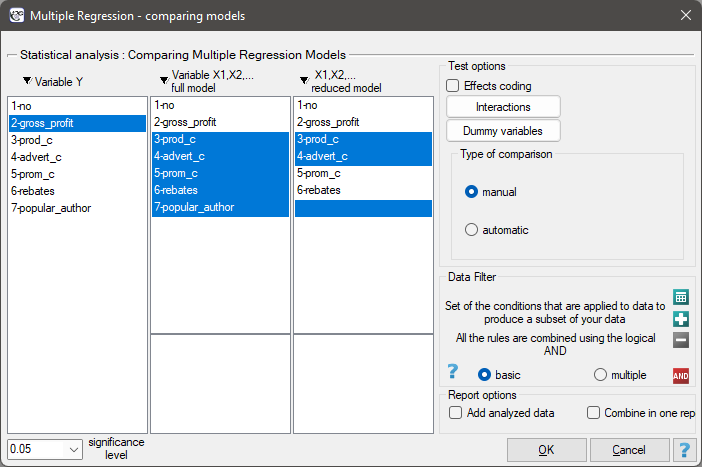
The window with settings for model comparison is accessed via the menu Advenced statistics→Multidimensional models→Multiple regression – model comparison
The multiple linear regression offers the possibility of simultaneous analysis of many independent variables. There appears, then, the problem of choosing the optimum model. Too large a model involves a plethora of information in which the important ones may get lost. Too small a model involves the risk of omitting those features which could describe the studied phenomenon in a reliable manner. Because it is not the number of variables in the model but their quality that determines the quality of the model. To make a proper selection of independent variables it is necessary to have knowledge and experience connected with the studied phenomenon. One has to remember to put into the model variables strongly correlated with the dependent variable and weakly correlated with one another.
There is no single, simple statistical rule which would decide about the number of variables necessary in the model. The measures of model adequacy most frequently used in a comparison are:  – the corrected value of multiple determination coefficient (the higher the value the more adequate the model),
  – the standard error of estimation (the lower the value the more adequate the model) or or information criteria AIC, AICc, BIC (the lower the value, the better the model). For that purpose, the F-test based on the multiple determination coefficient
  can also be used. The test is used to verify the hypothesis that the adequacy of both compared models is equally good.
Hypotheses:

where:
 – multiple determination coefficients in compared models (full and reduced).
The test statistics has the form presented below:

The statistics is subject to F-Snedecor distribution with  and
and  degrees of freedom.
The p-value, designated on the basis of the test statistic, is compared with the significance level  :
:

If the compared models do not differ significantly, we should select the one with a smaller number of variables. Because a lack of a difference means that the variables present in the full model but absent from the reduced model do not carry significant information. However, if the difference in the quality of model adequacy is statistically significant, it means that one of them (the one with the greater number of variables, with a greater or lesser value of the information criterion) is significantly better than the other one.
In the program PQStat the comparison of models can be done manually or automatically.
- Manual model comparison – construction of 2 models:
- a full model – a model with a greater number of variables,
- a reduced model – a model with a smaller number of variables – such a model is created from the full model by removing those variables which are superfluous from the perspective of studying a given phenomenon.
The choice of independent variables in the compared models and, subsequently, the choice of a better model on the basis of the results of the comparison, is made by the researcher.
- Automatic model comparison is done in several steps:
- [step 1] Constructing the model with the use of all variables.
- [step 2] Removing one variable from the model. The removed variable is the one which, from the statistical point of view, contributes the least information to the current model.
- [step 3] A comparison of the full and the reduced model.
- [step 4] Removing another variable from the model. The removed variable is the one which, from the statistical point of view, contributes the least information to the current model.
- [step 5] A comparison of the previous and the newly reduced model.
- […]
In that way numerous, ever smaller models are created. The last model only contains 1 independent variable.
As a result, each model is described with the help of adequacy measures (, , AIC, AICc, BIC), and the subsequent (neighboring) models are compared by means of the F-test. The model which is finally marked as statistically best is the model with the greatest and the smallest . However, as none of the statistical methods cannot give a full answer to the question which of the models is the best, it is the researcher who should choose the model on the basis of the results.
EXAMPLE cont. (publisher.pqs file)
To predict the gross profit from book sales a publisher wants to consider such variables as: production cost, advertising costs, direct promotion cost, the sum of discounts made, and the author's popularity. However, not all of those variables need to have a significant effect on profit. Let us try to select such a model of linear regression which will contain the optimum number of variables (from the perspective of statistics). For this analysis, we will use teaching set data.
Manual model comparison.
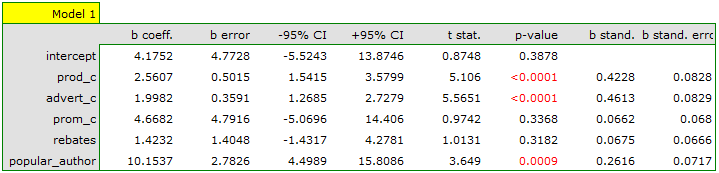
On the basis of the earlier constructed, full model we can suspect that the variables: direct promotion costs and the sum of discounts made have a small influence on the constructed model (i.e. those variables do not help predict the greatness of the profit). We will check if, from the perspective of statistics, the full model is better than the model from which the two variables have been removed.
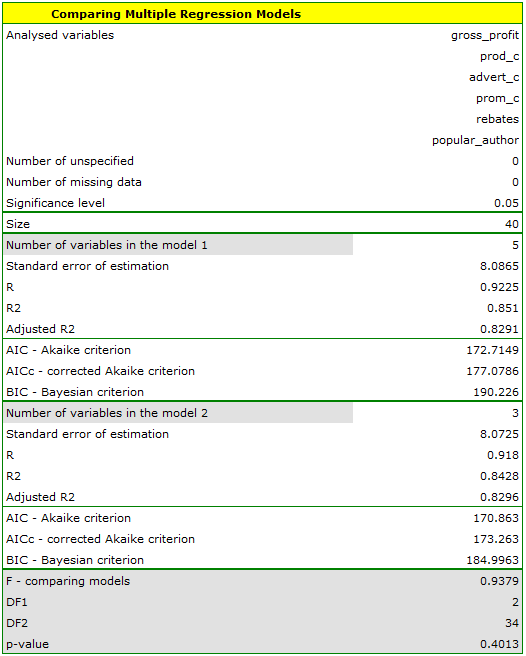
It turns out that there is no basis for thinking that the full model is better than the reduced model (the value  of F-test which is used for comparing models is
  ). Additionally, the reduced model is slightly more adequate than the full model (for the reduced model
  , for the full model
  and has smaller, or more favorable, values of the information criteria AIC, AIcc, BIC.
Automatic model comparison.
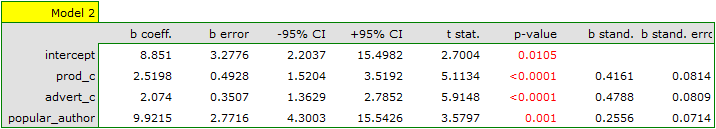
In the case of automatic model comparison we receive very similar results. The best model is the one with the greatest coefficient  , the smallest information criteria and the smalles standard estimation error . The best model we suggest is the model containing only 3 independent variables: the production cost, advertising costs, and the author's popularity.
On the basis of the analyses above, from the perspective of statistics, the optimum model is the model with the 3 most important independent variables: the production cost, advertising costs, and the author's popularity. However, the final decision which model to choose should be made by a person with specialist knowledge about the studied topic – in this case, the publisher. It ought to be remembered that the selected model should be constructed anew and its assumptions verified in the window
, the smallest information criteria and the smalles standard estimation error . The best model we suggest is the model containing only 3 independent variables: the production cost, advertising costs, and the author's popularity.
On the basis of the analyses above, from the perspective of statistics, the optimum model is the model with the 3 most important independent variables: the production cost, advertising costs, and the author's popularity. However, the final decision which model to choose should be made by a person with specialist knowledge about the studied topic – in this case, the publisher. It ought to be remembered that the selected model should be constructed anew and its assumptions verified in the window Multiple regression.
en/statpqpl/wielowympl/porownpl.txt · ostatnio zmienione: 2022/11/19 18:10 przez admin
Narzędzia strony
Wszystkie treści w tym wiki, którym nie przyporządkowano licencji, podlegają licencji: CC Attribution-Noncommercial-Share Alike 4.0 International
