Narzędzia użytkownika
Narzędzia witryny
Pasek boczny
en:statpqpl:porown2grpl:nparpl:rr_orpl
The Relative Risk and the Odds Ratio
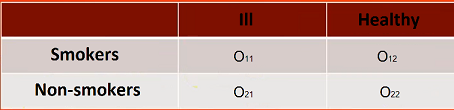
The risk and odds designation of occurence an analysed phenomenon, on the basis of exposure to the factor that can cause it, is estimated according to data collected in the contingency table  . For example, we can look at how cigarette smoking affects disease:
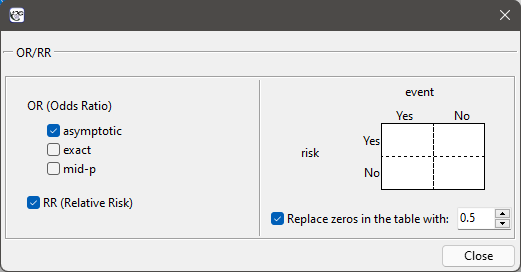
The window with the ability to determine these measures is called up via the menu can be opened in Statistics menu → NonParametric tests→chi-square, Fiser, OR/RR by selecting OR/RR or in ''Wizard''.
If a study is a case-control study, the odds ratio of occurence the phenomenon is calculated for the table. Usually, they are retrospective studies – the researcher decides on his own about the sample size, with the phenomenon, and about the control sample (without the phenomenon).
If a study is a cohort study, the relative risk of occurence the phenomenon is calculated for the table. Usually, they are prospective studies – the researcher cares about experiment conditions, because of the structure of an analysed phenomenon in a sample and in a population should be similar.
For the designation of odds ratio, we calculate the probability of being a case in the exposed group and in the unexposed group, according to the formulas:

 The Odds Ratio:

- The test of significance for the OR
This test is used to the hypothesis verification about the odds of occurence the analysed phenomenon is the same in the group of exposed and unexposed to the risk factor.
Hypotheses:

The test statistic is defined by:

where:
 – standard error of the
  .
.
The test statistic asymptotically (for large sample size) has the normal distribution.
The p-value, designated on the basis of the test statistic, is compared with the significance level  :
:

- Note
In the interpretation of odds ratio significance, we usually use the designated confidence interval. Then, we check if the interval contains the value of 1.
The relative risk (2 x 2 table)
In the cohort study, we can designate the risk of occurence the analysed phenomenon (because the structure of phenomenon, in the sample, should come closer to the population, from which the sample was taken) and calculate the relative risk ( ).
).
The estimated risk of occurence the analysed phenomenon is designated by the following formula  . However, the relative risk is designated by:

- The test of significance for the RR
This test is used to the hypothesis verification about the risk of occurrence the analysed occurrence is the same in the group of exposed and unexposed to the risk factor.
Hypotheses:

The test statistic is defined by:

where:
 – standard error of the
  .
.
The test statistic asymptotically (for large sample size) has the normal distribution.
The p-value, designated on the basis of the test statistic, is compared with the significance level :
- Note
In the interpretation of the relative risk significance, we usually use the designated confidence interval. Then, we check if the interval contains the value of 1.
Note
When zeros are present in the data table, then it may not be possible to calculate the odds ratio or relative risk. In such a situation, to ensure that the odds ratio can be determined, you can check the Replace zero in the table with: option in the analysis window. Selecting this option (adjustments for continuity) adds the set value to all cells in the table.
en/statpqpl/porown2grpl/nparpl/rr_orpl.txt · ostatnio zmienione: 2022/02/12 13:27 przez admin
Narzędzia strony
Wszystkie treści w tym wiki, którym nie przyporządkowano licencji, podlegają licencji: CC Attribution-Noncommercial-Share Alike 4.0 International
