Narzędzia użytkownika
Narzędzia witryny
Pasek boczny
en:statpqpl:porown2grpl:nparpl:chikw2x2pl
The Chi-square test for small tables
These tests are based on the data gathered in the form of a contingency table of 2 features ( ,
,  ), each of them has 2 possible categories
  and
and  (look at the table (\ref{tab_kontyngencji_obser})).
The  test for
  tables – The Pearson's Chi-square test (Karl Pearson 1900) is constraint of the Chi-square test for (r x c) tables.
The test statistic is defined by:

This statistic asymptotically (for large expected frequencies) has the Chi-square distribution with a 1 degree of freedom.
The settings window with the Chi-square test (2×2) can be opened in Statistics menu → NonParametric tests→Chi-square, Fisher, OR/RR or in ''Wizard''.
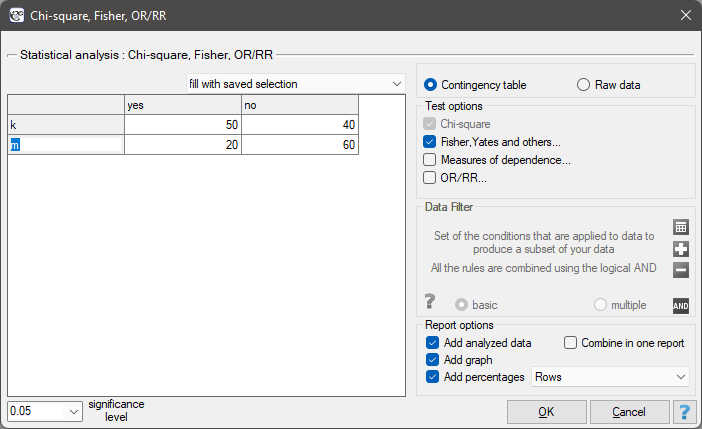
There is a sample consisting of 170 persons ( ). Using this sample, you want to analyse 2 features (=sex, =exam passing). Each of these features occurs in two categories (
 =f,
=f,  =m,
=m,  =yes,
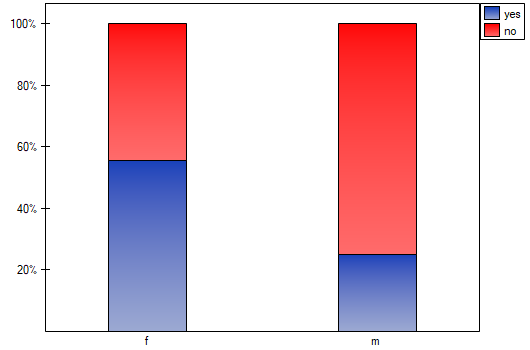
=yes,  =no). Based on the sample you want to get to know, if there is any dependence between sex and exam passing in the above population. The data distribution is presented in the contingency table below:

Hypotheses:

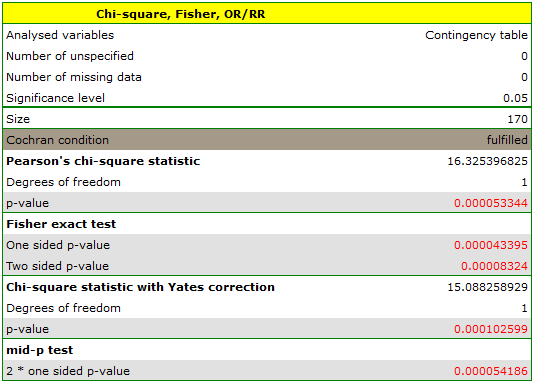
The expectation count table contains no values less than 5. Cochran's condition is satisfied.
At the assumed significance level of  all tests performed confirmed the truth of the alternative hypothesis:
- chi-square test, p=0.000053,
- chi-square test with Yeates correction, p=0.000103,
- Fisher's exact test, p=0.000083,
- mid-p test, p=0.000054.
en/statpqpl/porown2grpl/nparpl/chikw2x2pl.txt · ostatnio zmienione: 2022/02/12 12:31 przez admin
Narzędzia strony
Wszystkie treści w tym wiki, którym nie przyporządkowano licencji, podlegają licencji: CC Attribution-Noncommercial-Share Alike 4.0 International
