Narzędzia użytkownika
Narzędzia witryny
Pasek boczny
en:statpqpl:diagnpl:testpl
Evaluation of diagnostic test
Suppose that using a diagnostic test we calculate the occurrence of a particular feature (most often disease) and know the gold-standard, so we know that the feature really occurs among the examined people. On the basis of these information, we can build a  contingency table:

where:
TP – true positive
FP – false positive
FN – false negative
TN – true negative
For such a table we can calculate the following measurements.
Sensitivity and specificity of diagnostic test
Every diagnostic test, in some cases, can obtain results different than actual results, for example a diagnostic test, basing on the obtained parameters, classifies a patient to the group of people suffering from a particular disease, or to the group of healthy people. In reality, the number of people approved for the above groups by the test may differ from the number of people genuinely ill and genuinely healthy.
There are two evaluation measurements of the test accuracy. They are:

Confidence interval is built on the basis of the Clopper-Pearson method for a single proportion.

Confidence interval is built on the basis of the Clopper-Pearson method for a single proportion.
Positive predictive values, negative predictive values and prevalence rate
 ) – the probability, that a person having a positive test result suffered from a disease. If the examined person obtains a positive test result, the PPV informs them how they can be sure, that they suffer from a particular disease.

Confidence interval is built on the basis of the Clopper-Pearson method for a single proportion.
 ) – the probability that a person having a negative test result did not suffer from any disease. If the examined person obtains a negative test result, the NPV informs them how they can be sure that they do not suffer from a particular disease.

Confidence interval is built on the basis of the Clopper-Pearson method for a single proportion.
Positive and negative predictive values depend on the prevalence rate.
Prevalence – probability of disease in the population for which the diagnostic test was conducted.

Confidence interval is built on the basis of the Clopper-Pearson method for a single proportion.
- Likelihood ratio of positive test and likelihood ratio of negative test
- Likelihood ratio of positive test (
 ) – this measurement enables the comparison of some test results matching to the gold-standard. It does not depend on the prevalence of the disease. It is the ratio of two odds: the odds that a person from the group of ill people will obtain a positive test result, and the same effect will be observed among healthy people.

Confidence interval for is built on the basis of the standard error:


Confidence interval for  is built on the basis of the standard error:

- Accuracy (
 ) – the probability of a correct diagnose using a diagnostic test. If the examined person obtains a positive or a negative test result, the informs how they can be sure about the definitive diagnosis.

Confidence interval is built on the basis of the Clopper-Pearson method for a single proportion.

Confidence interval for  is built on the basis of the standard error:

The settings window with the diagnostic tests can be opened in Advanced stistics menu →Diagnostic tests → Diagnostic tests
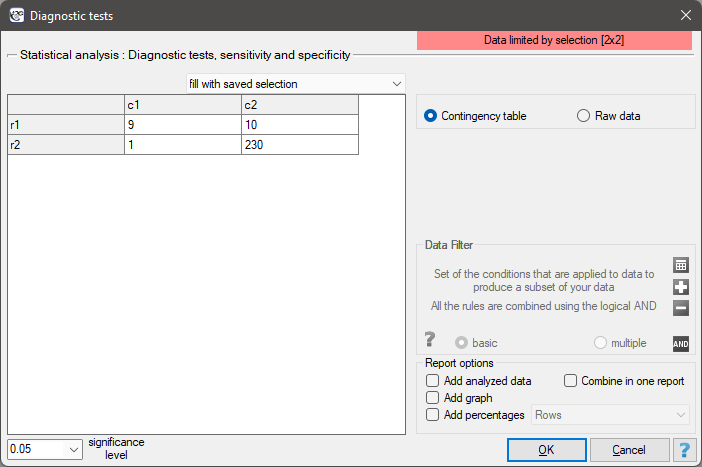
EXAMPLE (mammography.pqs file)
Mammography is one of the most popular screening tests which enables the detection of breast cancer. The following study has been carried out on the group of 250 people, so-called „asymptomatic” women at the age from 40 to 50. Mammography can detect an outbreak of cancer smaller than 5 mm and enables to note the change which is not a nodule yet but a change in the structure of tissues.

We will calculate the values enabling the assessment of the performed diagnostic test.
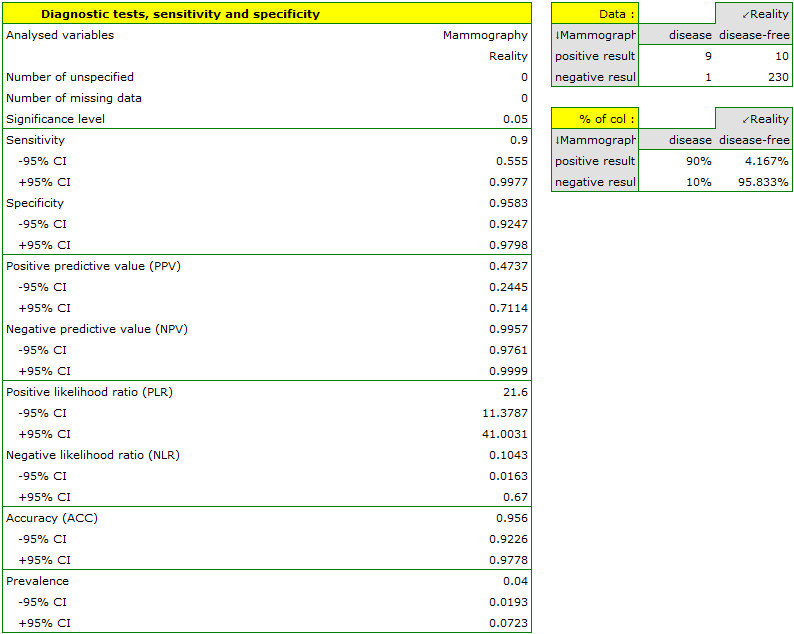
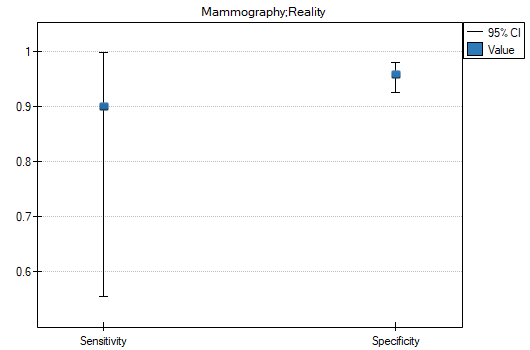
- 90% of women suffering from breast cancer have been correctly defined, so they have obtained the positive result of mammography;
- 95.83% of healthy women (not suffering from breast cancer) have been correctly defined, so they have obtained the negative result of mammography;
- 4 out of 100 examined women suffer from breast cancer;
- A woman who have obtained a positive mammography result can be 47.37% sure that she suffers from breast cancer;
- A women who have obtained a negative test result can be 99.57% sure that she does not suffer from breast cancer;
- The probability that the positive mammography result will be obtained by a woman genuinely suffering from cancer is 21.60 times greater than the probability that the positive mammography result will be obtained by a healthy woman (not suffering from breast cancer);
- The probability that the negative mammography result will be obtained by a woman genuinely suffering from breast cancer is 10.43% of the probability that the negative mammography result will be obtained by a healthy woman (not suffering from breast cancer);
- A woman undergoing mammography (regardless of age) can be 96.50% sure of the definitive diagnosis,
- The chance of a positive test result in a woman who actually has breast cancer is 207 times greater than the chance of such a result in a healthy woman.
en/statpqpl/diagnpl/testpl.txt · ostatnio zmienione: 2022/09/26 23:30 przez admin
Narzędzia strony
Wszystkie treści w tym wiki, którym nie przyporządkowano licencji, podlegają licencji: CC Attribution-Noncommercial-Share Alike 4.0 International
