Narzędzia użytkownika
Narzędzia witryny
Pasek boczny
en:statpqpl:porown2grpl:nparpl:wilcoxon2pl
The Wilcoxon test (matched-pairs)
The Wilcoxon matched-pairs test, is also called as the Wilcoxon test for dependent groups (Wilcoxon 19451),19492)). It is used if the measurement of an analysed variable you do twice, each time in different conditions. It is the extension for the two dependent samples of the Wilcoxon test (signed-ranks) – designed for a one sample. We want to check how big is the difference between the pairs of measurements ( ) for each of
  analysed objects. This difference is used to verify the hypothesis determining that the median of the difference in the analysed population counts to 0.
Basic assumptions:
- measurement on an ordinal scale or on an interval scale,
Hypotheses:

where:
 – median of the differences
  in a population.
The p-value, designated on the basis of the test statistic, is compared with the significance level  :
:

Note
Depending on the sample size, the test statistic is calculated by using different formulas:
- For small a sample size:

 – sums of positive
  – sums of negative ranks.
This statistic has the Wilcoxon distribution and does not contain any correction for ties.
- For a large sample size

 – number of ranked signs (number of the ranks),
 – number of the cases included in a
The formula for the Z statistic includes the correction for ties. This correction is used, when the ties occur (if there are no ties, the correction is not calculated, because of  ).
).
The  statistic (for large sample sizes) asymptotically has the normal distribution.
The Wilcoxon test with the continuity correction (Marascuilo and McSweeney (1977)3))
The continuity correction is used to guarantee the possibility of taking in all the values of the real numbers by the test statistic, according to the assumption of the normal distribution. The test statistic with the continuity correction is defined by:

Note
The median calculated for the difference column includes all pairs of results except those with a difference of 0.
Standardized effect size
The distribution of the Wilcoxon test statistic is approximated by the normal distribution, which can be converted to an effect size  4) to then obtain the Cohen's d value according to the standard conversion used for meta-analyses:

When interpreting an effect, researchers often use general guidelines proposed by 5) defining small (0.2), medium (0.5) and large (0.8) effect sizes.
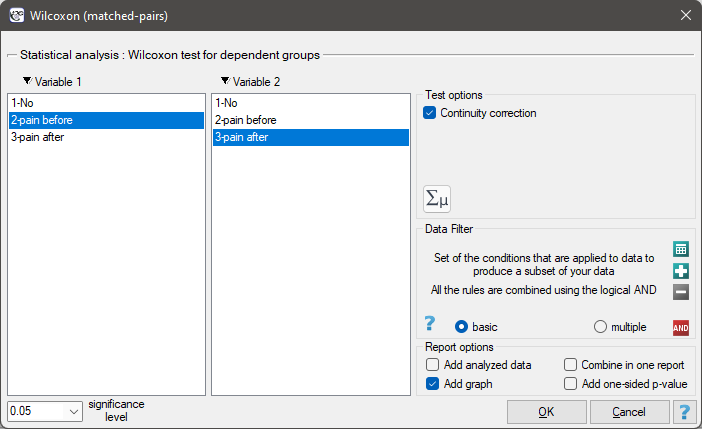
The settings window with the Wilcoxon test for dependent groups can be opened in Statistics menu → NonParametric tests→Wilcoxon (matched-pairs) or in ''Wizard''.
There was chosen a sample consisting of 22 patients suffering from a cancer. They were examined to check the level of felt pain (1 – 10 scale, where 1 means the lack of pain and 10 means unbearable pain). This examination was repeated after a month of the treatment with a new medicine which was supposed to lower the level of felt pain. There were obtained the following results:
(pain before, pain after): (2, 2) (2, 3) (3, 1) (3,1) (3, 2) (3, 2) (3, 3) (4, 1) (4, 3) (4, 4) (5, 1) (5, 1) (5, 2) (5, 4) (5, 4) (6, 1) (6, 3) (7, 2) (7, 4) (7, 4) (8, 1) (8, 3). Now, you want to check if this treatment has any influence on the level of felt pain in the population, from which the sample was chosen.
Hypotheses:

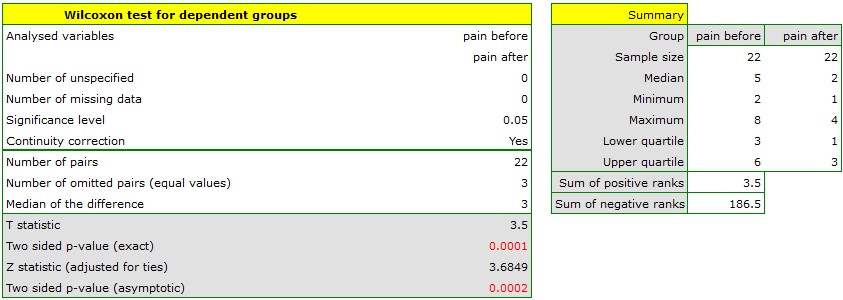
Comparing the  </latex> value = 0.0001 of the Wilcoxon test, based on the
  statistic, with the significance level
  you assume, that there is a statistically significant difference if concerning the level of felt pain between these 2 examinations. The difference is, that the level of pain decreased (the sum of the negative ranks is significantly greater than the sum of the positive ranks). Exactly the same decision you would make on the basis of
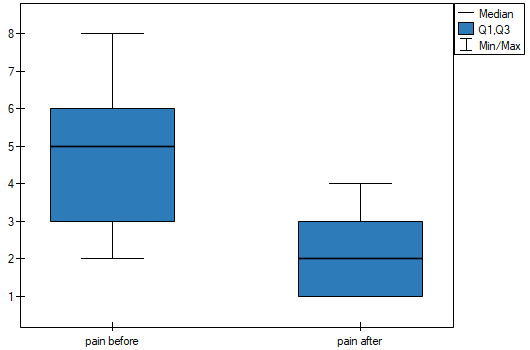
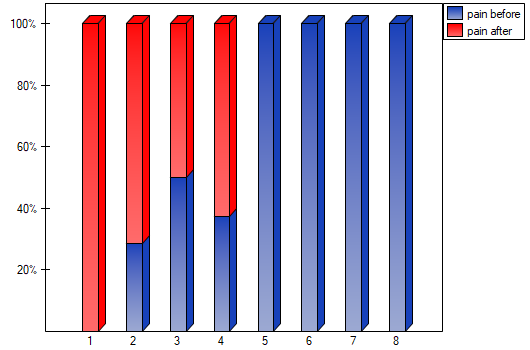
  value = 0.00021 or value = 0.00023 of the Wilcoxon test which is based on the statistic or the statistic with the continuity correction. We can see the differences in a box-and-whisker plot or a column plot.
1)
Wilcoxon F. (1945), Individual comparisons by ranking methods. Biometries, 1, 80-83
2)
Wilcoxon F. (1949), Some rapid approximate statistical procedures. Stamford, CT: Stamford Research Laboratories, American Cyanamid Corporation
3)
Marascuilo L.A. and McSweeney M. (1977), Nonparametric and distribution-free method for the social sciences. Monterey, CA: Brooks/Cole Publishing Company
4)
Fritz C.O., Morris P.E., Richler J.J.(2012), Effect size estimates: Current use, calculations, and interpretation. Journal of Experimental Psychology: General., 141(1):2–18.
5)
Cohen J. (1988), Statistical Power Analysis for the Behavioral Sciences, Lawrence Erlbaum Associates, Hillsdale, New Jersey
en/statpqpl/porown2grpl/nparpl/wilcoxon2pl.txt · ostatnio zmienione: 2022/09/14 14:12 przez admin
Narzędzia strony
Wszystkie treści w tym wiki, którym nie przyporządkowano licencji, podlegają licencji: CC Attribution-Noncommercial-Share Alike 4.0 International
