Narzędzia użytkownika
Narzędzia witryny
Pasek boczny
en:statpqpl:porown1grpl:nparpl:wilcoxon1grpl
The Wilcoxon test (signed-ranks)
The Wilcoxon signed-ranks test is also known as the Wilcoxon single sample test, Wilcoxon (1945, 1949)1). This test is used to verify the hypothesis, that the analysed sample comes from the population, where median ( ) is a given value.
Basic assumptions:
- measurement on an ordinal scale or on an interval scale.
Hypotheses:

where:
– median of an analysed feature of the population represented by the sample,
 – a given value.
Now you should calculate the value of the test statistics  (
( – for the small sample size), and based on this
  value.
The p-value, designated on the basis of the test statistic, is compared with the significance level  :
:

Note
Depending on the size of the sample, the test statistic takes a different form:
- for a small sample size

where:
 and
and  are adequately: a sum of positive and negative ranks.
This statistic has the Wilcoxon distribution.
- for a large sample size

where:
 - the number of ranked signs (the number of ranks),
 - the number of cases being included in the interlinked rank.
The test statistic formula includes the correction for ties. This correction should be used when ties occur (when there are no ties, the correction is not calculated, because  .
.
statistic asymptotically (for a large sample size) has the normal distribution.
Continuity correction of the Wilcoxon test (Marascuilo and McSweeney (1977)2))
A continuity correction is used to enable the test statistic to take in all values of real numbers, according to the assumption of the normal distribution. Test statistic with a continuity correction is defined by:

Standardized effect size
The distribution of the Wilcoxon test statistic is approximated by the normal distribution, which can be converted to an effect size  3) to then obtain the Cohen's d value according to the standard conversion used for meta-analyses:

When interpreting an effect, researchers often use general guidelines proposed by 4) defining small (0.2), medium (0.5) and large (0.8) effect sizes.
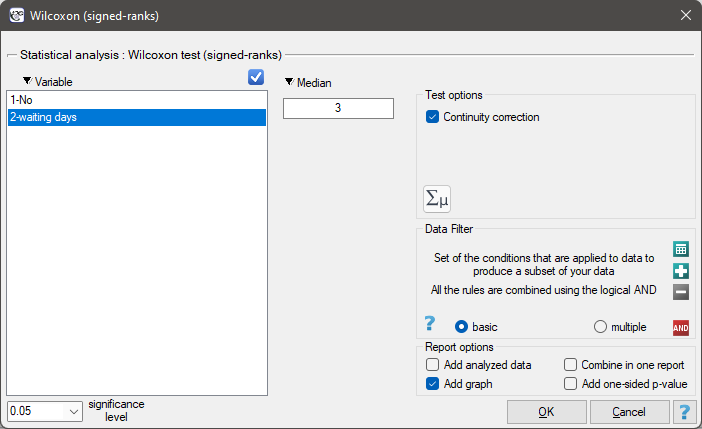
The settings window with the Wilcoxon test (signed-ranks) can be opened in Statistics menu
NonParametric tests→Wilcoxon (signed-ranks) or in ''Wizard''.
EXAMPLE cont. (courier.pqs file)
Hypotheses:

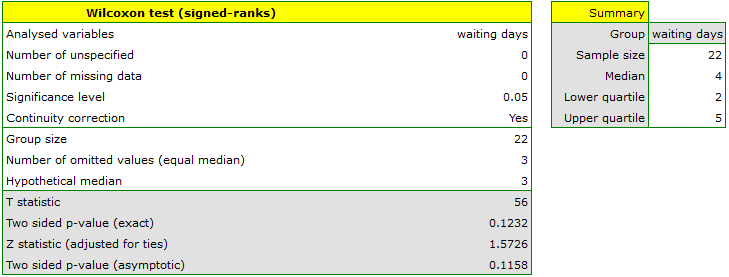
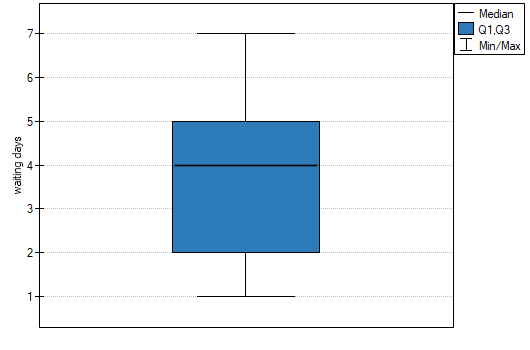
Comparing the p-value = 0.1232 of Wilcoxon test based on statistic with the significance level  we draw the conclusion, that there is no reason to reject the null hypothesis informing us, that usually the number of awaiting days for the delivery which is supposed to be delivered by the analysed courier company is 3. Exactly the same decision you would make basing on the p-value = 0.1112 or p-value = 0.1158 of Wilcoxon test based upon statistic or with correction for continuity.
1)
Wilcoxon F. (1945), Individual comparisons by ranking methods. Biometries 1, 80-83
2)
Marascuilo L.A. and McSweeney M. (1977), Nonparametric and distribution-free method for the social sciences. Monterey, CA: Brooks Cole Publishing Company
3)
Fritz C.O., Morris P.E., Richler J.J.(2012), Effect size estimates: Current use, calculations, and interpretation. Journal of Experimental Psychology: General., 141(1):2–18.
4)
Cohen J. (1988), Statistical Power Analysis for the Behavioral Sciences, Lawrence Erlbaum Associates, Hillsdale, New Jersey
en/statpqpl/porown1grpl/nparpl/wilcoxon1grpl.txt · ostatnio zmienione: 2022/09/14 14:12 przez admin
Narzędzia strony
Wszystkie treści w tym wiki, którym nie przyporządkowano licencji, podlegają licencji: CC Attribution-Noncommercial-Share Alike 4.0 International
