Narzędzia użytkownika
Narzędzia witryny
Pasek boczny
en:statpqpl:wielowympl:logistpl:pred
Model-based prediction and test set validation
Validation
Validation of a model is a check of its quality. It is first performed on the data on which the model was built (the so-called training data set), that is, it is returned in a report describing the resulting model. To be able to judge with greater certainty how suitable the model is for forecasting new data, an important part of the validation is to apply the model to data that were not used in the model estimation. If the summary based on the training data is satisfactory, i.e. the determined errors,  coefficients and information criteria are at a satisfactory level, and the summary based on the new data (the so-called test data set) is equally favorable, then with high probability it can be concluded that such a model is suitable for prediction. The test data should come from the same population from which the training data were selected. It is often the case that before building a model we collect data, and then randomly divide it into a training set, i.e. the data that will be used to build the model, and a test set, i.e. the data that will be used for additional validation of the model.
The settings window with the validation can be opened in Advanced statistics→Multivariate models→Logistic regression - prediction/validation.
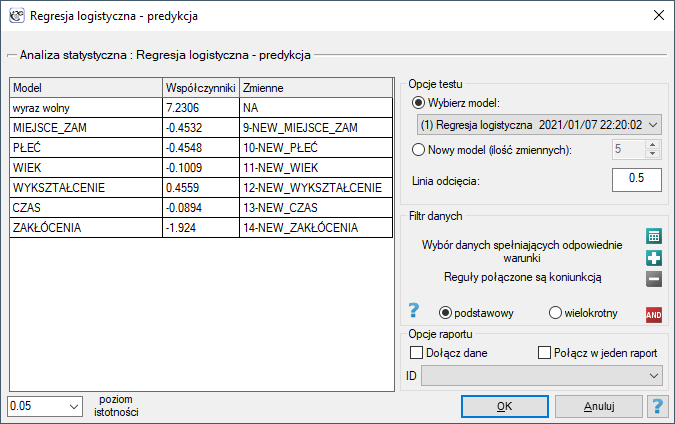
To perform validation, it is necessary to indicate the model on the basis of which we want to perform the validation. Validation can be done on the basis of:
- logistic regression model built in PQStat - simply select a model from the models assigned to the sheet, and the number of variables and model coefficients will be set automatically; the test set should be in the same sheet as the training set;
- model not built in PQStat but obtained from another source (e.g., described in a scientific paper we have read) - in the analysis window, enter the number of variables and enter the coefficients for each of them.
In the analysis window, indicate those new variables that should be used for validation.
Prediction
Most often, the final step in regression analysis is to use the built and previously validated model for prediction.
- Prediction for a single object can be performed along with model building, that is, in the analysis window
Advanced statistics→Multivariate models→Logistic regression, - Predykcja dla większej grupy nowych danych jest wykonywana poprzez menu
Advanced statistics→Multivariate models→Logistic regression - prediction/validation.
To make a prediction, it is necessary to indicate the model on the basis of which we want to make the prediction. Prediction can be made on the basis of:
- logistic regression model built in PQStat - simply select a model from the models assigned to the sheet, and the number of variables and model coefficients will be set automatically; the test set should be in the same sheet as the training set;
- model not built in PQStat but obtained from another source (e.g., described in a scientific paper we have read) - in the analysis window, enter the number of variables and enter the coefficients for each of them.
In the analysis window, indicate those new variables that should be used for prediction.
Based on the new data, the value of the probability predicted by the model is determined and then the prediction of the occurrence of an event (1) or its absence (0). The cutoff point based on which the classification is performed is the default value  . The user can change this value to any value in the range
  such as the value suggested by the ROC curve.
Przykład c.d. (task.pqs file)
In an experiment examining concentration skills, a logistic regression model was built for a group of 130 training set subjects based on the following variables:
dependent variable: SOLUTION (yes/no) - information about whether the task was solved correctly or not;
independent variables:
ADDRESSOFRES (1=urban/0=rural),
SEX (1=female/0=male),
AGE (in years),
EDUCATION (1=basic, 2=vocational, 3=secondary, 4=higher education),
SOLUTION Time (in minutes),
DISTURBANCES (1=yes/0=no).
However, only four variables, AGE, EDUCATION, RESOLUTION TIME, and DISTURBANCES, contribute relevant information to the model. We will build a model for the training set data based on these four variables and then, to make sure it will work properly, we will validate it on a test data set. If the model passes this test, we will use it to make predictions for new individuals. To use the right collections we set a data filter each time.
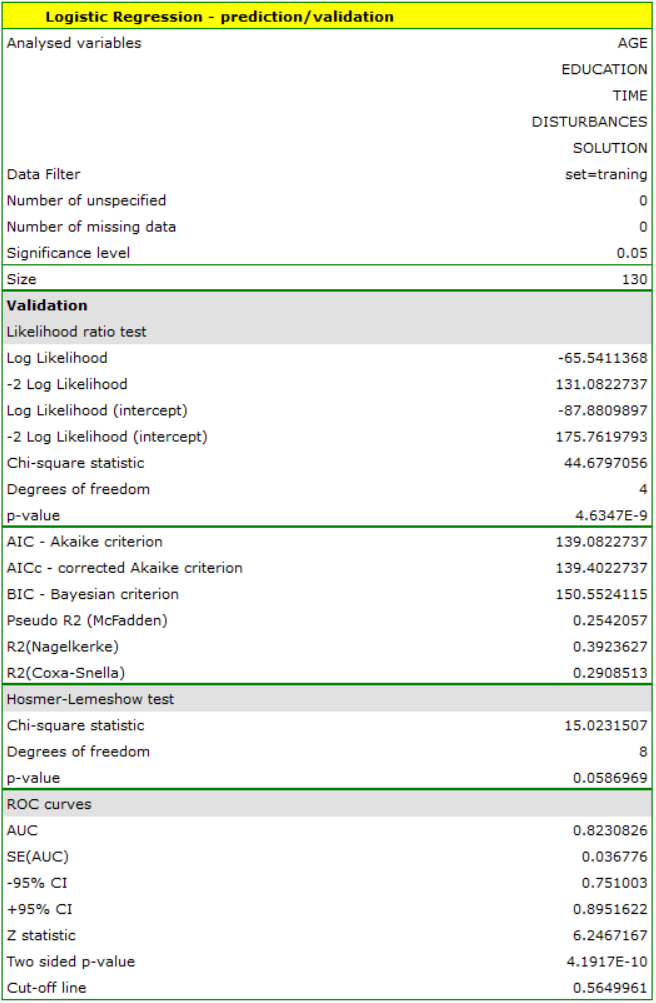
For the training set, the values describing the quality of the model's fit are not very high  and
and  , but already the quality of its prediction is satisfactory (AUC[95%CI]=0.82[0.75, 0.90], sensitivity =82%, specificity 60%).
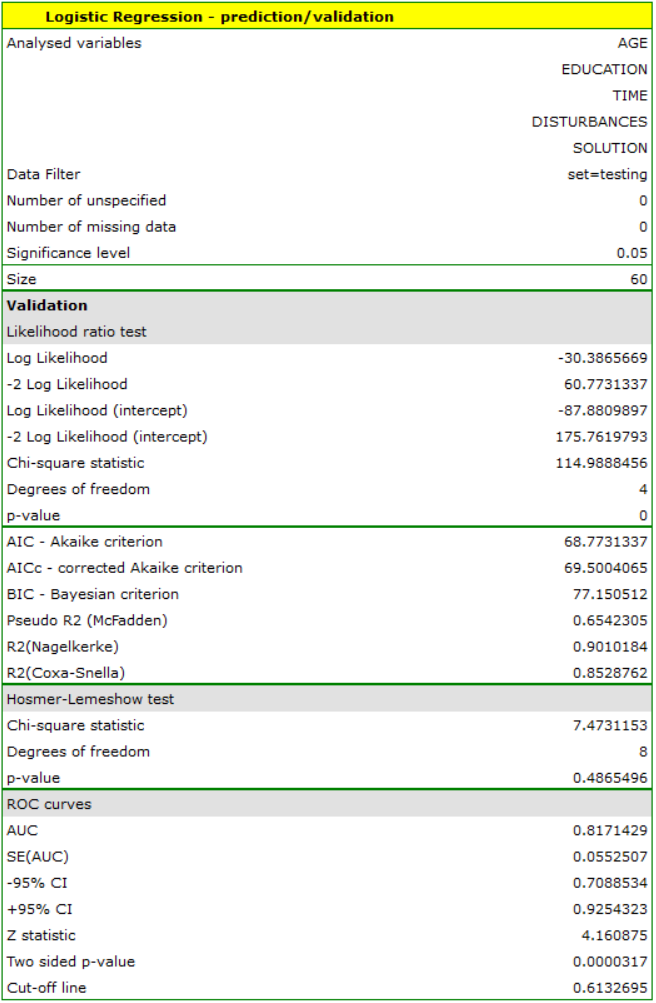
For the test set, the values describing the quality of the model fit are even higher than for the training data  and
and  . The prediction quality for the test data is still satisfactory (AUC[95%CI]=0.82[0.71, 0.93], sensitivity =73%, specificity 64%), so we will use the model for prediction. To do this, we will use the data of three new individuals added at the end of the set. We'll select
 Prediction, set a filter on the new dataset, and use our model to predict whether the person will solve the task correctly (get a value of 1) or incorrectly (get a value of 0).
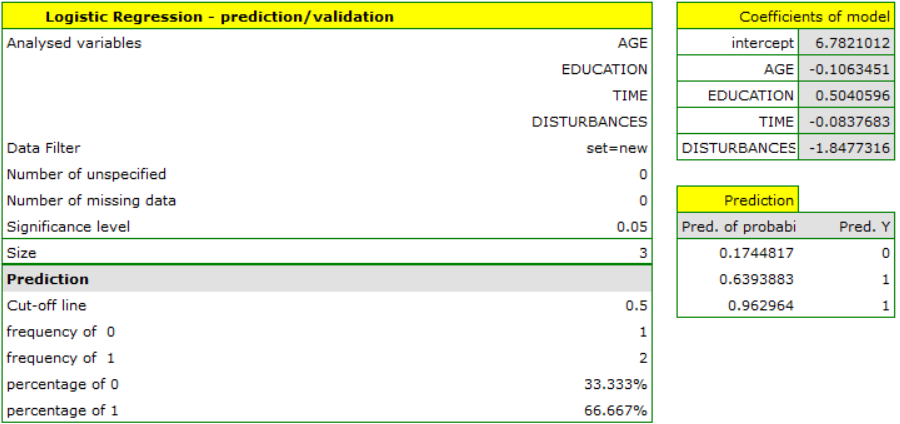
We find that the prediction for the first person is negative, while the prediction for the next two is positive. The prognosis for a 50-year-old woman with an elementary education solving the test during the interference in 20 minutes is 0.17, which means that we predict that she will solve the task incorrectly, while the prognosis for a woman 20 years younger is already favorable - the probability of her solving the task is 0.64. The highest probability (equal to 0.96) of a correct solution has the third woman, who solved the test in 10 minutes and without disturbances.
If we wanted to make a prediction based on another model (e.g., obtained during another scientific study: SOLUTION=6-0.1*AGE+0.5*EDUCATION-0.1*TIME-2*DISTURBANCES) - it would be enough to select a new model in the analysis window, set its coefficients and the forecast for the selected people can be repeated based on this model.
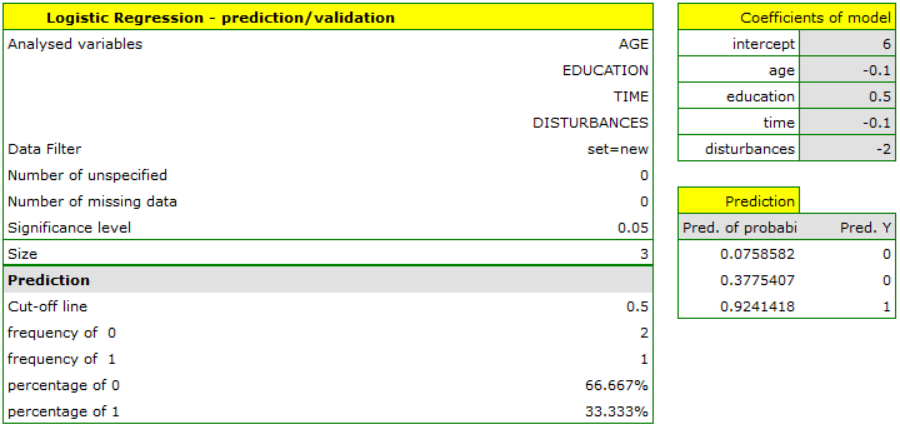
This time, according to the prediction of the new model, the prediction for the first and second person is negative, and the third is positive.
en/statpqpl/wielowympl/logistpl/pred.txt · ostatnio zmienione: 2023/03/31 19:04 przez admin
Narzędzia strony
Wszystkie treści w tym wiki, którym nie przyporządkowano licencji, podlegają licencji: CC Attribution-Noncommercial-Share Alike 4.0 International
