Narzędzia użytkownika
Narzędzia witryny
Pasek boczny
en:statpqpl:porown2grpl:nparpl:z_zalrpl
The Z Test for two dependent proportions
 Test for two dependent proportions is used in situations similar to the **McNemar's Test**, i.e. when we have 2 dependent groups of measurements (
 i
i  ), in which we can obtain 2 possible results of the studied feature ((+)(–)).

We can also calculated distinguished proportions for those groups  i
i  . The test serves the purpose of verifying the hypothesis that the distinguished proportions
  and
and  in the population from which the sample was drawn are equal.
Basic assumptions:
- measurement on the nominal - any order is not taken into account,
- large sample size.
Hypotheses:

where:
, fractions for the first and the second measurement.
The test statistic has the form presented below:

The Statistic asymptotically (for the large sample size) has the normal distribution.
The p-value, designated on the basis of the test statistic, is compared with the significance level  :
:

Note
Confidence interval for the difference of two dependent proportions is estimated on the basis of the Newcombe-Wilson method.
The window with settings for Z-Test for two dependent proportions is accessed via the menu Statistics→Nonparametric tests→Z-Test for two dependent proportions.
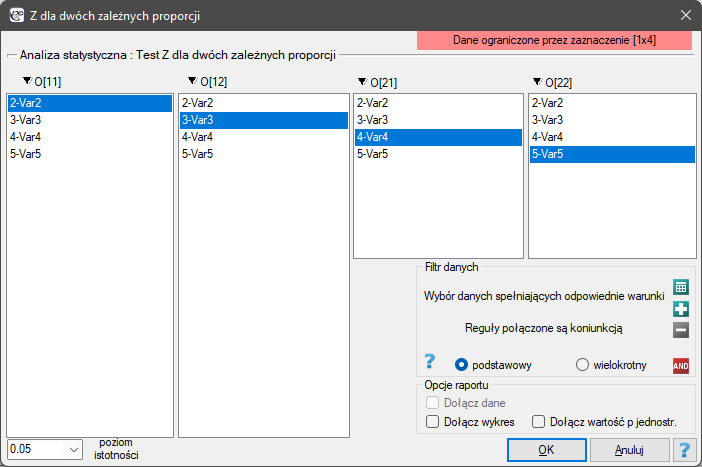
EXAMPLE cont. (opinion.pqs file)
When we limit the study to people who have a specific opinion about the professor (i.e. those who only have a positive or a negative opinion) we will have 152 such students. The data for calculations are:  ,
,  ,
,  ,
,  . We know that
  students expressed a negative opinion before the exam. After the exam the percentage was
  .
.
Hypotheses:

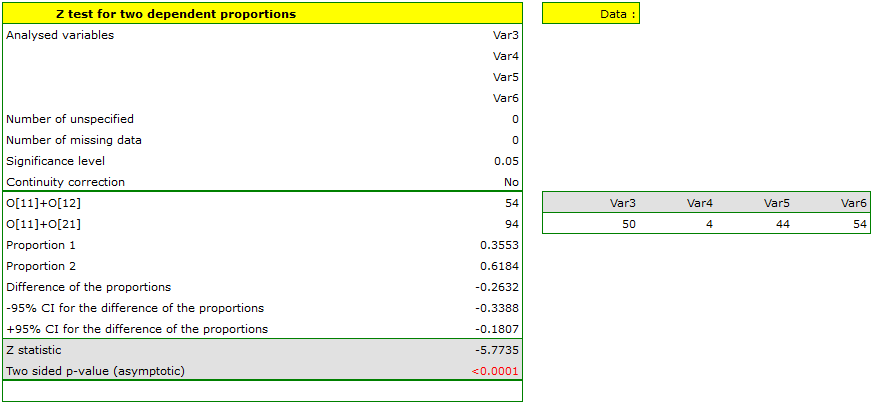
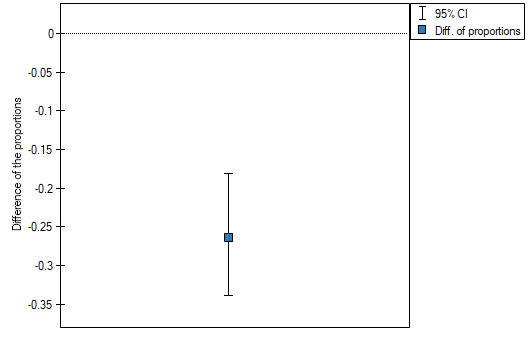
The difference in proportions distinguished in the sample is 26.32%, and the confidence interval of 95% for the sample (18.07%, 33.88%) does not contain 0.
On the basis of a test (p<0.0001), on the significance level of =0.05 (similarly to the case of McNemar's test) we accept the alternative hypothesis. Therefore, the proportion of negative evaluations before the exam differs from the proportion of negative evaluations after the exam. Indeed, after the exam there are more negative evaluations of the professor.
en/statpqpl/porown2grpl/nparpl/z_zalrpl.txt · ostatnio zmienione: 2022/02/12 15:53 przez admin
Narzędzia strony
Wszystkie treści w tym wiki, którym nie przyporządkowano licencji, podlegają licencji: CC Attribution-Noncommercial-Share Alike 4.0 International
