Narzędzia użytkownika
Narzędzia witryny
Pasek boczny
en:statpqpl:porown2grpl:nparpl:fishercxrpl
The Fisher's test for large tables
The Fisher test for  tables is also called the Fisher-Freeman-Halton test (Freeman G.H., Halton J.H. (1951)1)). This test is an extension on tables of the Fisher's exact test. It defines the exact probability of an occurrence specific distribution of numbers in the table (when we know
  and we set the marginal totals).
If you define marginal sums of each row as:

where:
 – observed frequencies in a table,
and the marginal sums of each column as:

then, having defined the marginal sums for the different distributions of the observed frequencies represented by  , you can calculate the
  probabilities:

where

The exact significance level  : is the sum of probabilities (calculated for new values ), which are smaller or equal to probability of the table with the initial numbers
  .
.
The exact p-value, designated on the basis of the test statistic, is compared with the significance level  .
.
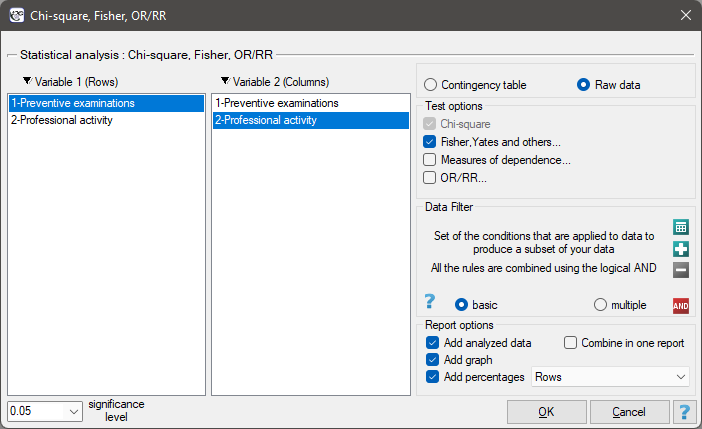
The settings window with the Fisher exact test (RxC) can be opened in Statistics menu → NonParametric tests → Chi-square, Fisher, OR/RR or in ''Wizard''.
Info.
The process of calculation of p-values for this test is based on the algorithm published by Mehta (1986)2).
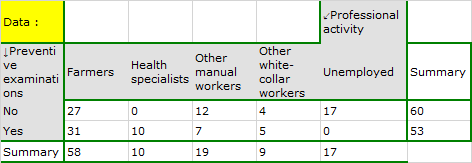
EXAMPLE (job prevention.pqs file)
In the population of people living in the rural areas of Komorniki municipality it was examined whether the performance of preventive health examinations depends on the type of occupational activity of the residents. A random sample of 120 people was collected and asked about their education and whether they perform preventive examinations. Complete answers were obtained from 113 persons.
Hypotheses:

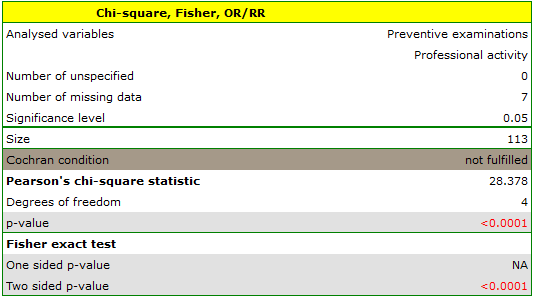
Cochran's condition is not satisfied, thus we should not use the chi-square test.
Value p<0.0001. Therefore, at the significance level  we can say that there is a relationship between the performance of preventive examinations and the type of work performed by residents of rural areas of Komorniki municipality.
If we are interested in more precise information about the correlations detected, we will obtain it by determining multiple comparisons through the options
we can say that there is a relationship between the performance of preventive examinations and the type of work performed by residents of rural areas of Komorniki municipality.
If we are interested in more precise information about the correlations detected, we will obtain it by determining multiple comparisons through the options Fisher, Yates and others… and then Multiple column comparisons (RxC) and one of the corrections e.g. Benjamini-Hochberg.
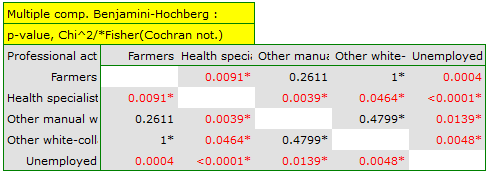
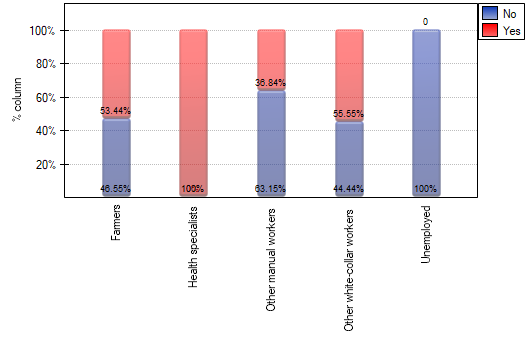
A closer analysis allows us to conclude that health professionals perform preventive examinations significantly more often than the other groups (100% of people in this group performed examinations), and the unemployed significantly less often (no one in this group performed an examination). Farmers, other manual workers and other white-collar workers take preventive examinations in about 50%, which means that these three groups are not statistically significantly different from each other. Part of the p-values obtained in the table is marked with an asterisk, it denotes those results which were obtained by using the Fisher's exact test with Benjamini-Hochberg correction, values not marked with an asterisk are the results of the chi-square test with Benjamini-Hochberg correction, in which Cochran's assumptions were fulfilled.
1)
Freeman G.H. and Halton J.H. (1951), Note on an exact treatment of contingency, goodness of fit and other problems of significance. Biometrika 38:141-149
2)
Mehta C.R. and Patel N.R. (1986), Algorithm 643. FEXACT: A Fortran subroutine for Fisher's exact test on unordered r*c contingency tables. ACM Transactions on Mathematical Software, 12, 154–161
en/statpqpl/porown2grpl/nparpl/fishercxrpl.txt · ostatnio zmienione: 2022/02/12 12:37 przez admin
Narzędzia strony
Wszystkie treści w tym wiki, którym nie przyporządkowano licencji, podlegają licencji: CC Attribution-Noncommercial-Share Alike 4.0 International
