Narzędzia użytkownika
Narzędzia witryny
Pasek boczny
en:statpqpl:porown2grpl:nparpl:chikwcxrpl
The Chi-square test for large tables
These tests are based on the data gathered in the form of a contingency table of 2 features ( ,
,  ). One of them has possible
  categories
  and the other one
  categories
  (look at the table (\ref{tab_kontyngencji_obser})).
The  test for
  tables is also known as the Pearson's Chi-square test (Karl Pearson 1900). This test is an extension on 2 features of the Chi-square test (goodness-of-fit).
The test statistic is defined by:

This statistic asymptotically (for large expected frequencies) has the [en:statpqpl:rozkladypl:ciaglepl#rozklad_chi_kwadrat|Chi-square distribution]] with a number of degrees of freedom calculated using the formula:  .
.
The p-value, designated on the basis of the test statistic, is compared with the significance level  .
.
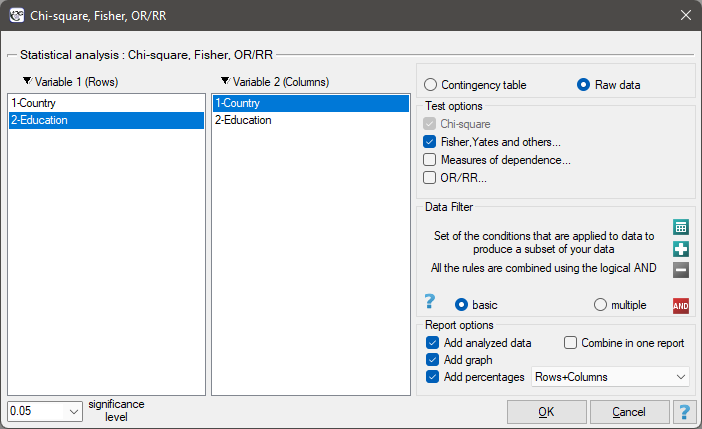
The settings window with the Chi-square test (RxC) can be opened in Statistics menu → NonParametric tests → Chi-square, Fisher, OR/RR or in ''Wizard''
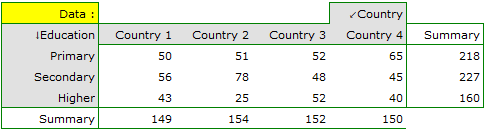
EXAMPLE (country-education.pqs file)
There is a sample of 605 persons ( ), who had 2 features analysed for (=country of residence, =education). The first feature occurrs in 4 categories, and the second one in 3 categories (
 =Country 1,
  =Country 2,
  =Country 3,
  =Country 4,
  =primary,
  =secondary,
  =higher). The data distribution is shown below, in the contingency table:
Based on this sample, you would like to find out if there is any dependence between education and country of residence in the analysed population.
Hypotheses:

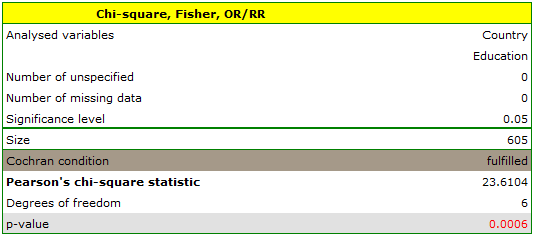
Cochran's condition is satisfied.
The p-value = 0.0006. So, on the basis of the significance level  we can draw the conclusion that there is a dependence between education and country of residence in the analysed population.
If we are interested in more precise information about the detected dependencies, we will obtain it by determining multiple comparisons through the options
we can draw the conclusion that there is a dependence between education and country of residence in the analysed population.
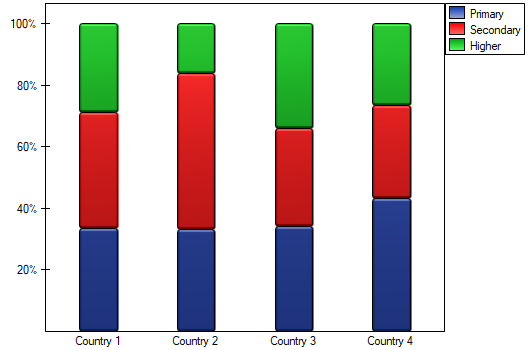
If we are interested in more precise information about the detected dependencies, we will obtain it by determining multiple comparisons through the options Fisher, Yates and others… and then Multiple column comparisons (RxC) and one of the corrections e.g. Benjamini-Hochberg
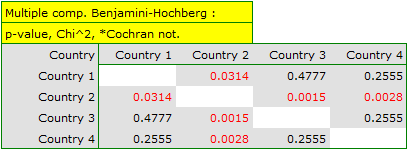
A closer look reveals that only the second country differs from the other countries in educational attainment in a statistically significant way.
en/statpqpl/porown2grpl/nparpl/chikwcxrpl.txt · ostatnio zmienione: 2022/02/12 12:24 przez admin
Narzędzia strony
Wszystkie treści w tym wiki, którym nie przyporządkowano licencji, podlegają licencji: CC Attribution-Noncommercial-Share Alike 4.0 International
