Narzędzia użytkownika
Narzędzia witryny
Pasek boczny
en:statpqpl:metapl:efpods
Summary effect
As a result of the meta-analysis, its most desirable element is to summarize the collected studies, i.e., to report the overall effect,  . Such a summary can be done in two ways, by designating a fixed effect or a random effect.
- Fixed effect
In calculating the fixed effect, we assume that all studies in the meta-analysis share one common true effect. Thus, if each study involved the same population, e.g., the same country, then to summarize the meta-analysis with a fixed effect we assume that the true (population) effect will be the same in each of these studies. Consequently, all factors that could disturb the size of this effect are the same. For example, if the effect obtained can be affected by the age or gender of the subjects, then these factors are similar in each study. Thus, differences in the obtained effects for individual studies are due only to sampling error (the inherent error of each study) - that is, the size of  .
.
The fixed effect estimates the population effect – the true effect for each study.
The confidence interval around the fixed effect (the width of the rhombus in the forest plot) depends only on specific .
- Random effect
In calculating the random effect, we assume that each study represents a slightly different population, so that the true (population) effect will be different for each population. Thus, if each study involved a different country, then in order to summarize the meta-analysis with a random effect, we assume that some factors that could distort the magnitude of the effect may have different magnitudes across countries. For example, if the effect (e.g., the average increase in fertility) can be affected by the education level of the respondents or the wealth of a country, and these countries differ in these factors, then the true effect (the average increase in fertility) will be slightly different in each of these countries. Thus, the differences in the obtained effects for each study are due to sampling error (the error within each study) – that is, the size of , and the differences between the study populations (the variance between the studies - the heterogeneity of the studies) – i.e.,  . This heterogeneity cannot be too large, too much variance between study populations indicates no basis for a overall summary.
The random effect estimates a weighted mean of the true (population) effects of each study.
The confidence interval around the variable effect (the width of the rhombus in the forest plot) depends on individual and on .
Confidence interval vs. prediction interval
95% confidence interval (width of the rhombus in the forest plot) - means that in 95 percent of cases of such meta-analyses the overall random effect will fall into the interval determined by the rhombus.
95% prediction interval - means that 95 percent of the time the true (population) effect of the new study will fall into the designated interval.
The meta-analysis settings window is opened menu: Advanced Statistics→Meta-analysis→Meta-analysis, summary.
In this window, depending on the Final Effect selected, you can summarize the meta-analysis and perform basic analyses to check its assumptions such as heterogeneity, publication bias (sensitivity testing, asymmetry) and perform a cumulative meta-analysis.
EXAMPLE (MetaAnalysisRR.pqs file)
The risk of disease X for smokers and non-smokers has been studied. Some research papers indicated that the risk of disease X was higher for smokers, while some papers did not prove such a relationship. A meta-analysis was planned to determine whether cigarette smoking affects the occurrence of disease X. A thorough review of the literature on this topic was performed, and based on this, 10 scientific papers were selected for meta-analysis. These papers had data on the basis of which it was possible to calculate the relative risk (i.e. the risk of the disease for smokers in relation to the risk of the disease for non-smokers) and it was possible to establish the error with which the given relative risk is burdened (i.e. the precision of the given study). Data were prepared for meta-analysis and stored in a file.
Because the papers included in the meta-analysis were from different locations and included slightly different populations, the summary was chosen using random effect. As the final effect, relative risk was selected and the results were presented on a forest plot.
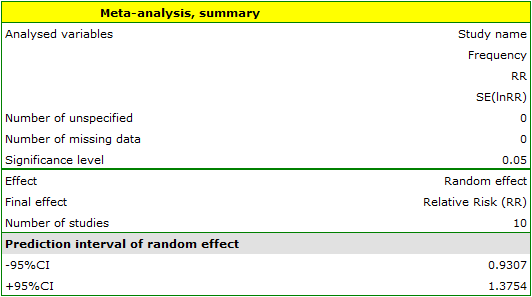
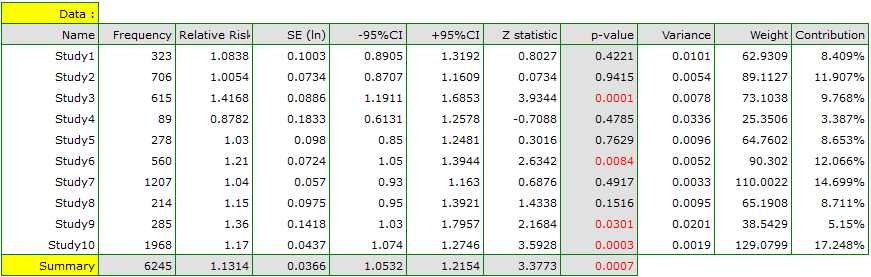
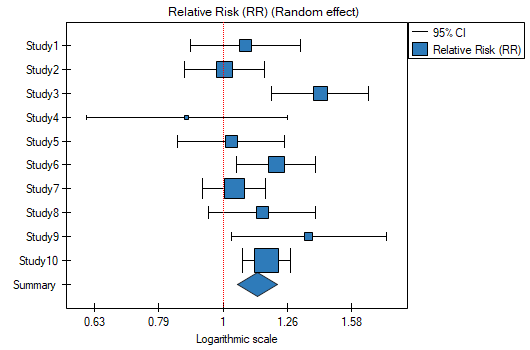
The results of four studies (studies 3, 6, 9, and 10) indicate a significantly higher risk of disease for smokers. The overall result of the meta-analysis conducted is also statistically significant and confirms the same effect. The derived relative risk for the overall effect along with the 95 percent confidence interval is above the value of one: RR[95%CI]=1.13[1.05-1.22]. Unfortunately, the prediction interval for the variable effect is wider: [0.93-1.38], which means that in 95\% of the cases, the true population relative risk obtained in subsequent studies could be either greater or less than one.
Note
Before interpreting the results, it is important to check that the assumptions of the meta-analysis are met. In this case, we should consider excluding the third study (see sensitivity analysis , asymmetry analysis, cumulative meta-analysis and the assumption of heterogeneity).
en/statpqpl/metapl/efpods.txt · ostatnio zmienione: 2022/03/19 12:07 przez admin
Narzędzia strony
Wszystkie treści w tym wiki, którym nie przyporządkowano licencji, podlegają licencji: CC Attribution-Noncommercial-Share Alike 4.0 International
