Narzędzia użytkownika
Narzędzia witryny
Pasek boczny
en:statpqpl:metapl:skumul
Cumulative meta-analysis
The typical purpose of conducting a cumulative meta-analysis is to show how the effect has changed since the last meta-analysis on a topic was conducted/published, or how it has changed over the years. Then chronologically (according to the timeline) more studies are added and the overall effect is calculated each time. Equally important is the cumulative analysis in a study of how the overall effect changes depending on the magnitude of the impact of a selected additional factor. The studies are then sorted according to the magnitude of that factor and the for successively added studies, a cumulative overall effect is calculated.
Depending on the purpose of the cumulation, the variable by which the individual studies will be sorted should be chosen, i.e., the order in which the studies are added to the meta-analysis summary. This can be any numerical variable.
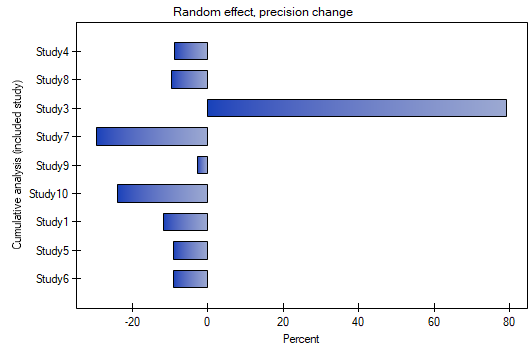
The assigned value of Cumulative contribution defines the percentage that is represented by the total weight of the included studies in the analysis i.e., the given study and the studies preceding it. In contrast, Precision change indicates how the precision of the overall effect (the width of the confidence interval) will change when a given study is included with the studies preceding it.
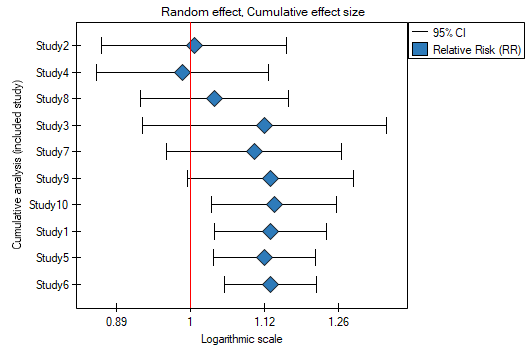
A good illustration of the cumulative analysis is a forest plot of the effect size and a plot of the change in precision, with each study included.
EXAMPLE cont. (MetaAnalyzisRR.pqs file)
By investigating the effect of cigarette smoking on the onset of disease X, we examined how the results evolved over time. To do this, the cumulative meta-analysis was selected in the analysis window as well as the variable by which subsequent papers would be included in the meta-analysis, and forest plot (cumulative) and bar plot (cumulative) were specified.
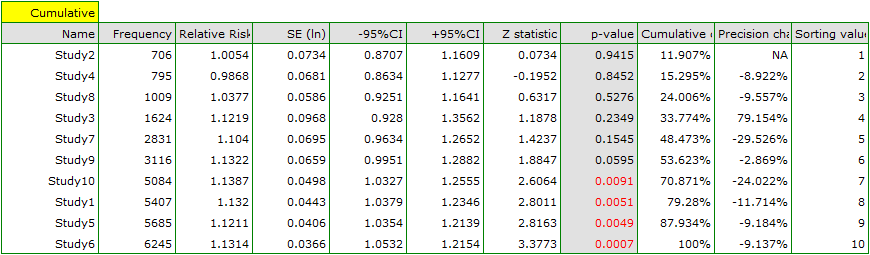
As new papers were added, the resulting overall effect gained strength, and its significance was obtained by adding Study 10 to the earlier papers, and then subsequent studies as well. In general, the addition of more papers increased the precision of the derived relative risk, except when Study 3 was added. The confidence interval of the overall relative risk then increased by 79.15%. We see this effect in the table and in the accompanying charts. As a result, one should consider excluding Study 3 from the meta-analysis.
en/statpqpl/metapl/skumul.txt · ostatnio zmienione: 2022/03/19 12:45 przez admin
Narzędzia strony
Wszystkie treści w tym wiki, którym nie przyporządkowano licencji, podlegają licencji: CC Attribution-Noncommercial-Share Alike 4.0 International
