Narzędzia użytkownika
Narzędzia witryny
Pasek boczny
en:statpqpl:zgodnpl:nparpl:kendalpl
The Kendall's concordance coefficient and a test to examine its significance
The Kendall's  coefficient of concordance is described in the works of Kendall, Babington-Smith (1939)1) and Wallis (1939)2). It is used when the result comes from different sources (from different raters) and concerns a few (
 ) objects. However, the assessment concordance is necessary. Is often used in measuring the interrater reliability strength – the degree of (raters) assessment concordance.
The Kendall's coefficient of concordance is calculated on an ordinal scale or a interval scale. Its value is calculated according to the following formula:

where:
 – number of different assessments sets (the number of raters),
 – number of ranked objects,
 ,
,
 – ranks ascribed to the following objects
  , independently for each rater
  ,
,
 – a correction for ties,
 – number of cases incorporated into tie.
The coefficient's formula includes  – the correction for ties. This correction is used, when ties occur (if there are no ties, the correction is not calculated, because of
  ).
).
Note
 – the Kendall's coefficient in a population;
– the Kendall's coefficient in a sample.
The value of  and it should be interpreted in the following way:
 means a strong concordance in raters assessments;
 means a lack of concordance in raters assessments.
The Kendall's W coefficient of concordance vs. the Spearman coefficient:
- When the values of the Spearman
 correlation coefficient (for all possible pairs) are calculated, the average coefficient – marked by
  is a linear function of coefficient:

The Kendall's W coefficient of concordance vs. the Friedman ANOVA:
- The Kendall's coefficient of concordance and the Friedman ANOVA are based on the same mathematical model. As a result, the value of the chi-square test statistic for the Kendall's coefficient of concordance and the value of the chi-square test statistic for the Friedman ANOVA are the same.
The chi-square test of significance for the Kendall's coefficient of concordance
Basic assumptions:
- measurement on an ordinal scale or on an interval scale.
Hypotheses:

The test statistic is defined by:
 This statistic asymptotically (for large sample sizes) has the Chi-square distribution with the degrees of freedom calculated according to the following formula:
  .
.
The p-value, designated on the basis of the test statistic, is compared with the significance level  :
:

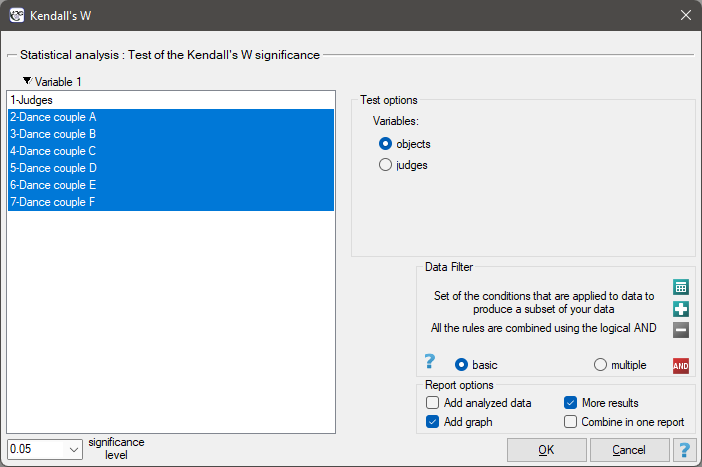
The settings window with the test of the Kendall's W significance can be opened in Statistics menu →NonParametric tests→Kendall's W or in ''Wizard''.
In the 6.0 system, dancing pairs grades are assessed by 9 judges. The judges point for example an artistic expression. They asses dancing pairs without comparing each of them and without placing them in the particular „podium place” (they create a ranking). Let's check if the judges assessments are concordant.

Hypotheses:

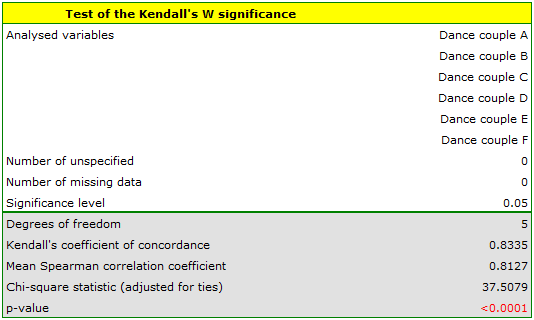
Comparing the p <0.0001 with the significance level  , we have stated that the judges assessments are statistically concordant. The concordance strength is high:
  , similarly the average Spearman's rank-order correlation coefficient:
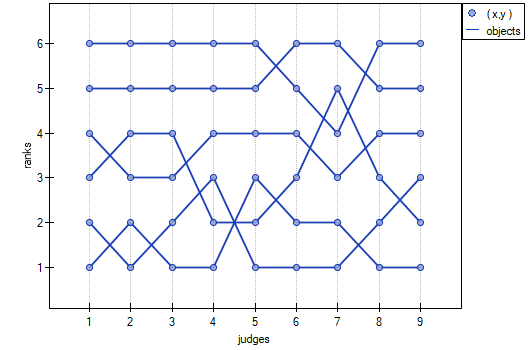
  . This result can be presented in the graph, where the X-axis represents the successive judges. Then the more intersection of the lines we can see (the lines should be parallel to the X axis, if the concordance is perfect), the less there is the concordance of rateres evaluations.
en/statpqpl/zgodnpl/nparpl/kendalpl.txt · ostatnio zmienione: 2022/02/13 21:28 przez admin
Narzędzia strony
Wszystkie treści w tym wiki, którym nie przyporządkowano licencji, podlegają licencji: CC Attribution-Noncommercial-Share Alike 4.0 International
