Narzędzia użytkownika
Narzędzia witryny
Pasek boczny
en:statpqpl:porown3grpl:nparpl:pagepl
The Page test for trend
The Page test for ordered alternative described in 1963 by Page E. B. 1) can be computed in the same situation as Friedman's ANOVA, since it is based on the same assumptions. However, Page's test captures the alternative hypothesis differently - indicating that there is a trend in subsequent measurements.
Hypotheses involve equality of the sum of ranks for successive measurements or are simplified to medians:

Note
The term: „with at least one strict inequality” written in the alternative hypothesis of this test means that at least one median should be greater than the median of another group of measurements in the order specified.
The test statistic has the form:
![\begin{displaymath}
Z=\frac{L-\left[\frac{nk(k+1)^2}{4}\right]}{\sqrt{\frac{n(k^3-k)^2}{144(k-1)}}}
\end{displaymath}](/lib/exe/fetch.php?media=wiki:latex:/imgd8f373e9725654f26c78c01931a87148.png "LaTeX")
where:
 ,
,
 – the sum of ranks of
  th measurement,
 –the weight for -th measurement informing about the natural order of this measurement among other measurements (weights are consecutive natural numbers).
Note
In order to perform a trend analysis, the expected ordering of measurements must be indicated by assigning consecutive natural numbers to successive measurement groups. These numbers are treated as weights in the analysis  ,
,  , …,
, …,  .
.
The formula for the test statistic  does not include a correction for ties, making it somewhat more conservative when tied ranks are present. However, using a correction for tied ranks for this test is not recommended.
The statistic has asymptotically (for large sample) normal distribution.
With the expected direction of the trend known, the alternative hypothesis is one-sided and the one-sided p-value is interpreted. Interpreting a two-sided p-value means that the researcher does not know (does not assume) the direction of the possible trend.
The p-value, designated on the basis of the test statistic, is compared with the significance level  :
:

The settings window with the Page test for trend can be opened in Statistics menu→NonParametric tests →Friedman ANOVA, trend test or in ''Wizard''
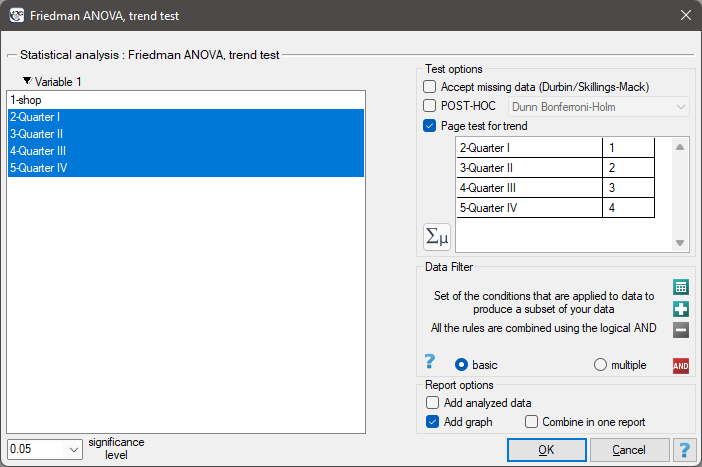
EXAMPLE cont. (chocolate bar.pqs file)
The expected result of the intensive advertising campaign conducted by the company is a steady increase in sales of the offered bar.
Hypotheses:

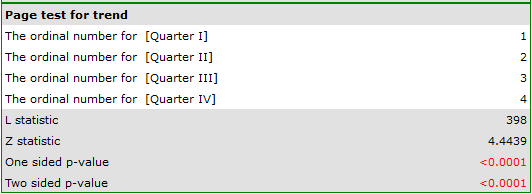
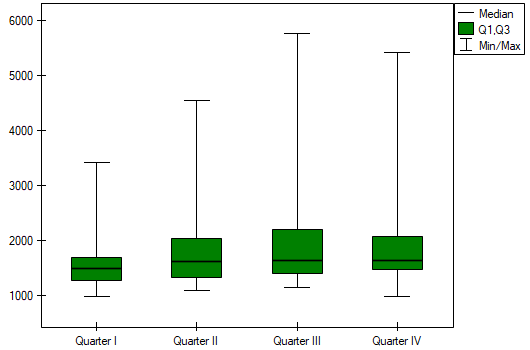
Comparing a one-sided p<0.0001 with a significance level  , we find that the campaign produced the expected trend of increased product sales.
1)
Page E. B. (1963), Ordered hypotheses for multiple treatments: A significance test for linear ranks. Journal of the American Statistical Association 58 (301): 216–30
en/statpqpl/porown3grpl/nparpl/pagepl.txt · ostatnio zmienione: 2022/02/13 16:47 przez admin
Narzędzia strony
Wszystkie treści w tym wiki, którym nie przyporządkowano licencji, podlegają licencji: CC Attribution-Noncommercial-Share Alike 4.0 International
