Narzędzia użytkownika
Narzędzia witryny
Pasek boczny
en:przestrzenpl:lokalpl:cutlinepl
CutL
CutL method was developed to detect clusters that have significantly higher prevalence than that specified by the investigator (Więckowska1)). As a result, the program locates clusters, examines their statistical significance, and plots them on a map.
Note
Analysis is based on the commonly used Binomial test for equal proportions.
Analyses are conducted on aggregated data (polygons map). In each of the two columns of the data sheet, enter the population size and number of cases for EACH object – these are the data required for proper analysis.

The settings window of CutL statistic can be opened in Spatial analysis→Spatial statistics→CutL
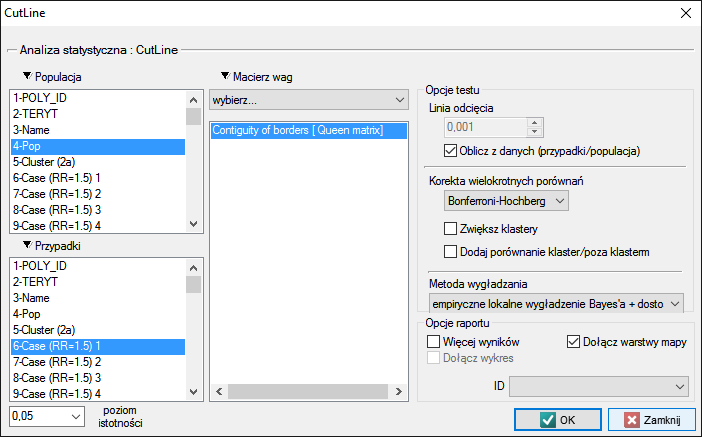
The analysis is based on data from the population size and number of cases, as well as the neighborhood matrix on the map.
Using the neighborhood matrix:
The Queen neighborhood matrix is the default chosen during the analysis. Other matrices may be used in this analysis, but this requires prior preparation and selection in the analysis window.
The cut-off line is the value above which statistically significant clusters can be detected and may be set in the analysis window. If the investigator does not specify this value, then it is set to the average prevalence calculated for the area under study.
Options
- Corrections for multiple comparisons – The following corrections for multiple comparisons may be used:
- Bonferroni-Hochberg
- Sidak-Hochberg
- Benjamini-Hochberg
- Compare cluster/outside
In addition, each cluster may be compared with the area outside of the cluster. The Binomial test for one proportion compares the prevalence within the cluster to the specified prevalence value, which is the prevalence outside of the cluster. Hypothesis testing is one-sided resulting from the higher prevalence inside the cluster than outside.
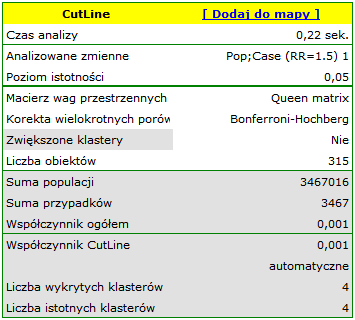
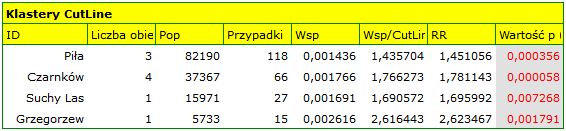
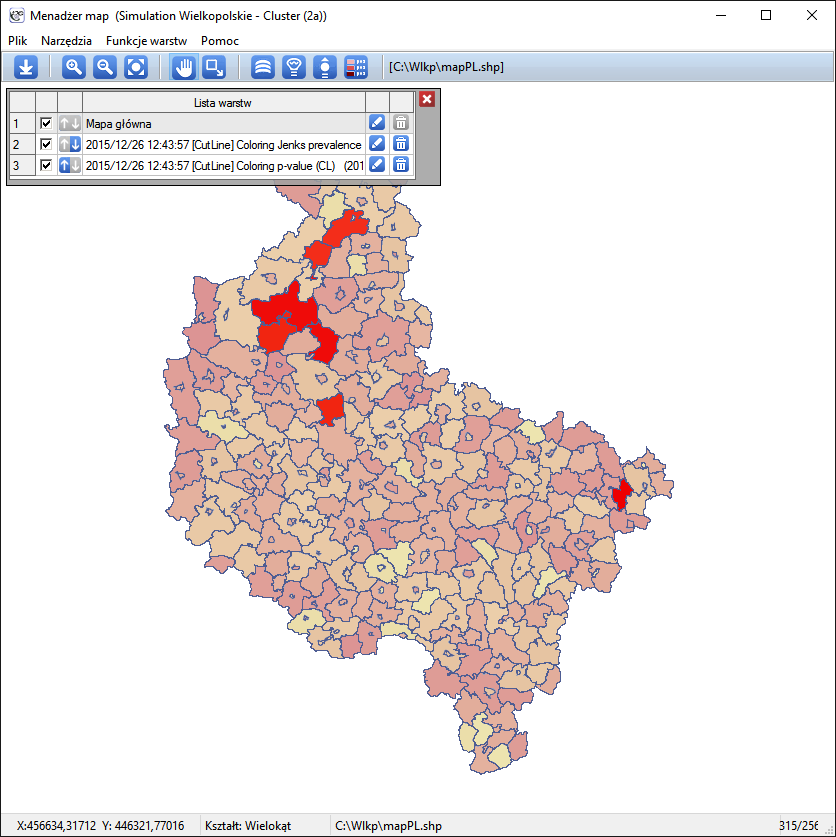
Results of Analysis
The results of the analysis are presented in the form of a report and map with superimposed layers.
Spatial-Temporal CutL
Using the CutL method, it is also possible to determine temporal-spatial clusters (Więckowska B. 2019 2)), i.e., clusters that do not persist for the entire time range under study, but only for a shorter period. Individual time layers are added to the datasheet by selecting Edit Timeline from the project tree, after indicating the appropriate map.
The spatio-temporal analysis window is obtained by selecting the menu Spatial analysis→Spatial statistics→CutL space-time.
1)
Więckowska B., Marcinkowska J. (2017), CutL: an alternative to Kulldorff’s scan statistics for cluster detection with a specified cut-off level. Geospatial Health, 12(2): 556
2)
Więckowska B., Górna I., Trojanowski M., Pruciak A., Stawińska-Witoszyńska B. (2019), Searching for space-time clusters: The CutL method compared to Kulldorff's scan statistic 14(2
en/przestrzenpl/lokalpl/cutlinepl.txt · ostatnio zmienione: 2022/02/16 14:19 przez admin
Narzędzia strony
Wszystkie treści w tym wiki, którym nie przyporządkowano licencji, podlegają licencji: CC Attribution-Noncommercial-Share Alike 4.0 International
