Narzędzia użytkownika
Narzędzia witryny
Pasek boczny
en:statpqpl:porown1grpl:nparpl:proppl
Tests for one proportion
You should use tests for proportion if there are two possible results to obtain (one of them is an distinguished result with the size of m) and you know how often these results occur in the sample (we know a Z proportion). Depending on a sample size  you can choose the Z test for a one proportion – for large samples and the exact binomial test for a one proportion – for small sample sizes . These tests are used to verify the hypothesis that the proportion in the population, from which the sample is taken, is a given value.
Basic assumptions:
- measurement on a nominal scale - any order is not taken into account.
The additional condition for the Z test for proportion
- large frequencies (according to Marascuilo and McSweeney interpretation (1977)1) each of these values:
 and
and  ).
).
Hypotheses:

where:
 – probability (distinguished proportion) in the population,
 – expected probability (expected proportion).
The Z test for one proportion
The test statistic is defined by:

where:
 distinguished proportion for the sample taken from the population,
 – frequency of values distinguished in the sample,
– sample size.
The test statistic with a continuity correction is defined by:

The  statistic with and without a continuity correction asymptotically (for large sizes) has the normal distribution.
Binomial test for one proportion
The binomial test for one proportion uses directly the binomial distribution which is also called the Bernoulli distribution, which belongs to the group of discrete distributions (such distributions, where the analysed variable takes in the finite number of values). The analysed variable can take in  values. The first one is usually definited with the name of a success and the other one with the name of a failure. The probability of occurence of a success (distinguished probability) is , and a failure
  .
.
The probability for the specific point in this distribution is calculated using the formula:

where:
 ,
,
– frequency of values distinguished in the sample,
– sample size.
Based on the total of appropriate probabilities  a one-sided and a two-sided p-value is calculated, and a two-sided value is defined as a doubled value of the less of the one-sided probabilities.
The p-value is compared with the significance level :
:

Note
Note that, for the estimator from the sample, which in this case is the value of the proportion, a confidence interval is calculated. The interval for a large sample size can be based on the normal distribution - so-called Wald intervals. The more universal are intervals proposed by Wilson (1927)2) and by Agresti and Coull (1998)3). Clopper and Pearson (1934)4) intervals are more adequate for small sample sizes.
Comparison of interval estimation methods of a binomial proportion was published by Brown L.D et al (2001)5)
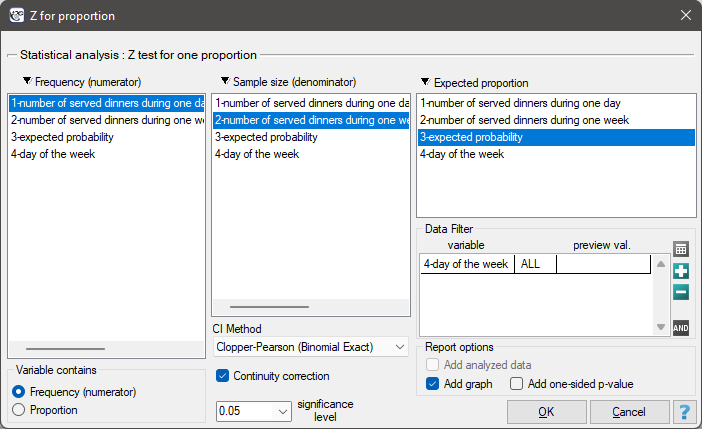
The settings window with the Z test for one proportion can be opened in Statistics menu→NonParametric tests (unordered categories)→Z for proportion.
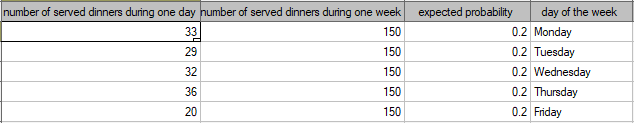
EXAMPLE cont. (dinners.pqs file)
Assume, that you would like to check if on Friday  of all the dinners during the whole week are served. For the chosen sample
  ,
,  .
.
Select the options of the analysis and activate a filter selecting the appropriate day of the week – Friday. If you do not activate the filter, no error will be generated, only statistics for given weekdays will be calculated.
Hypotheses:

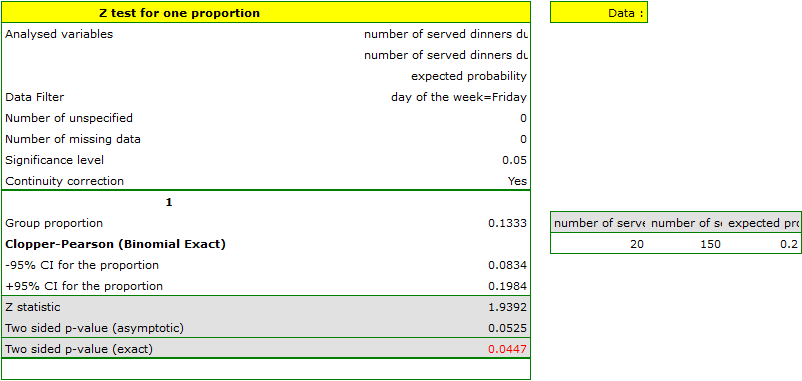
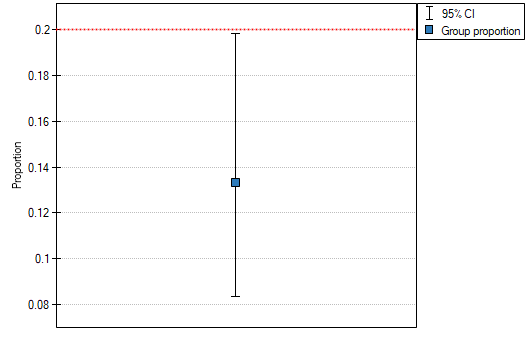
The proportion of the distinguished value in the sample is  and 95% Clopper-Pearson confidence interval for this fraction
  does not include the hypothetical value of 0.2.
Based on the Z test without the continuity correction (p-value = 0.0412) and also on the basis of the exact value of the probability calculated from the binomial distribution (p-value = 0.0447) you can assume (on the significance level  ), that on Friday there are statistically less than dinners served within a week. However, after using the continuity correction it is not possible to reject the null hypothesis p-value = 0.0525).
1)
Marascuilo L.A. and McSweeney M. (1977), Nonparametric and distribution-free method for the social sciences. Monterey, CA: Brooks Cole Publishing Company
2)
E.B. (1927), Probable Inference, the Law of Succession, and Statistical Inference. Journal of the American Statistical Association: 22(158):209-212
3)
Agresti A., Coull B.A. (1998), Approximate is better than „exact” for interval estimation of binomial proportions. American Statistics 52: 119-126
4)
Clopper C. and Pearson S. (1934), The use of confidence or fiducial limits illustrated in the case of the binomial. Biometrika 26: 404-413
5)
Brown L.D., Cai T.T., DasGupta A. (2001), Interval Estimation for a Binomial Proportion. Statistical Science, Vol. 16, no. 2, 101-133
en/statpqpl/porown1grpl/nparpl/proppl.txt · ostatnio zmienione: 2022/02/11 18:37 przez admin
Narzędzia strony
Wszystkie treści w tym wiki, którym nie przyporządkowano licencji, podlegają licencji: CC Attribution-Noncommercial-Share Alike 4.0 International
