Narzędzia użytkownika
Narzędzia witryny
Pasek boczny
en:statpqpl:wielowympl:wielorpl:predpl
Model-based prediction and test set validation
Validation
Validation of a model is a check of its quality. It is first performed on the data on which the model was built (the so-called training data set), that is, it is returned in a report describing the resulting model. In order to be able to judge with greater certainty how suitable the model is for forecasting new data, an important part of the validation is to become a model to data that were not used in the model estimation. If the summary based on the treining data is satisfactory, i.e., the determined errors  coefficients and information criteria are at a satisfactory level, and the summary based on the new data (the so-called test data set) is equally favorable, then with high probability it can be concluded that such a model is suitable for prediction. The testing data should come from the same population from which the training data were selected. It is often the case that before building a model we collect data, and then randomly divide it into a training set, i.e. the data that will be used to build the model, and a test set, i.e. the data that will be used for additional validation of the model.
The settings window with the validation can be opened in Advanced statistics→Multivariate models→Multiple regression - prediction/validation.
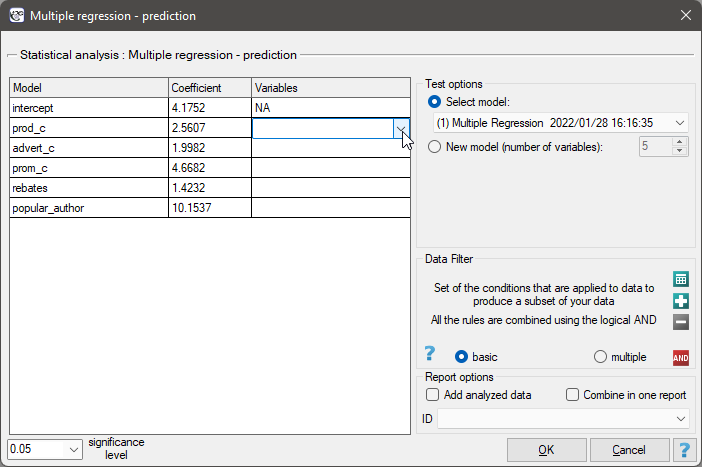
To perform validation, it is necessary to indicate the model on the basis of which we want to perform the validation. Validation can be done on the basis of:
- multivariate regression model built in PQStat - simply select a model from the models assigned to the sheet, and the number of variables and model coefficients will be set automatically; the test set should be in the same sheet as the training set;
- model not built in PQStat but obtained from another source (e.g., described in a scientific paper we have read) - in the analysis window, enter the number of variables and enter the coefficients for each of them.
In the analysis window, indicate those new variables that should be used for validation.
Prediction
Most often, the final step in regression analysis is to use the built and previously validated model for prediction.
- Prediction for a single object can be performed along with the construction of the model, that is, in the analysis window
Advanced statistics→Multivariate models→Multiple regression, - Prediction for a larger group of new data is done through the menu
Advanced statistics→Multivariate models→Multiple regression - prediction/validation.
To make a prediction, it is necessary to indicate the model on the basis of which we want to make the prediction. Prediction can be made on the basis of:
- multivariate regression model built in PQStat -simply select a model from the models assigned to the sheet, and the number of variables and model coefficients will be set automatically; the test set should be in the same sheet as the training set;
- model not built in PQStat but obtained from another source (e.g., described in a scientific paper we read) - in the analysis window, the number of variables and the coefficients on each of them should be entered.
In the analysis window, indicate those new variables that should be used for prediction. The estimated value is calculated with some error. Therefore, in addition, for the value predicted by the model, limits are set due to the error:
- confidence intervals are set for the expected value,
- For a single point, prediction intervals are determined.
Example continued (publisher.pqs file)
To predict gross profit from book sales, the publisher built a regression model based on a training set stripped of item 16 (that is, 39 books). The model included: production costs, advertising costs and author popularity (1=popular author, 0=not). We will build the model once again based on the learning set and then, to make sure the model will work properly, we will validate it on a test data set. If the model passes this test, we will apply it to predictions for book items. To use the right collections we set a data filter each time.
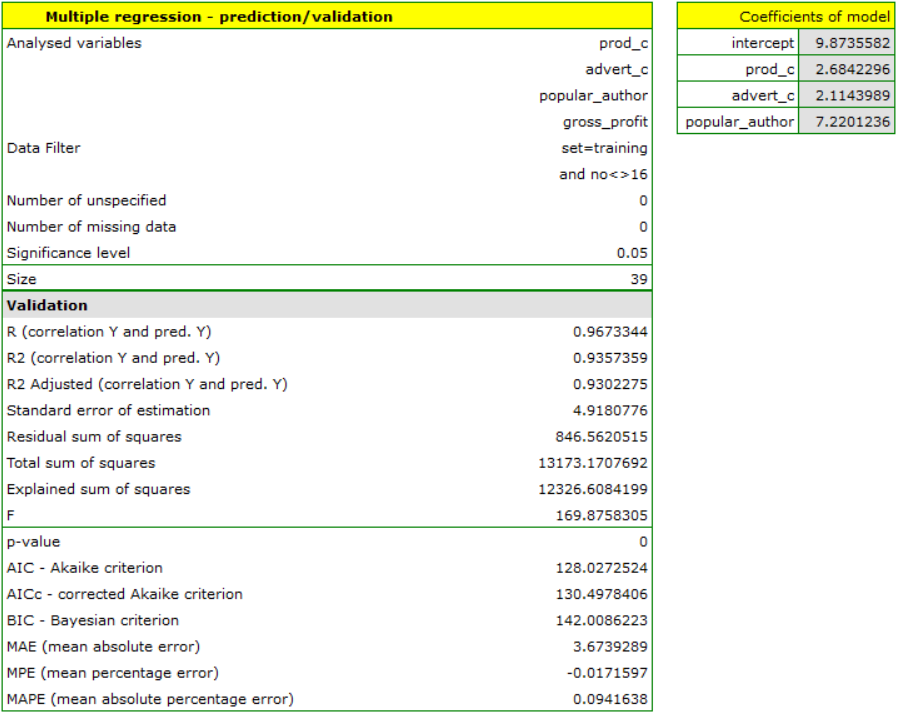
For the training set, the values describing the quality of the model's fit are very high: adjusted = 0.93 and the average forecast error (MAE) is 3.7 thousand dollars.
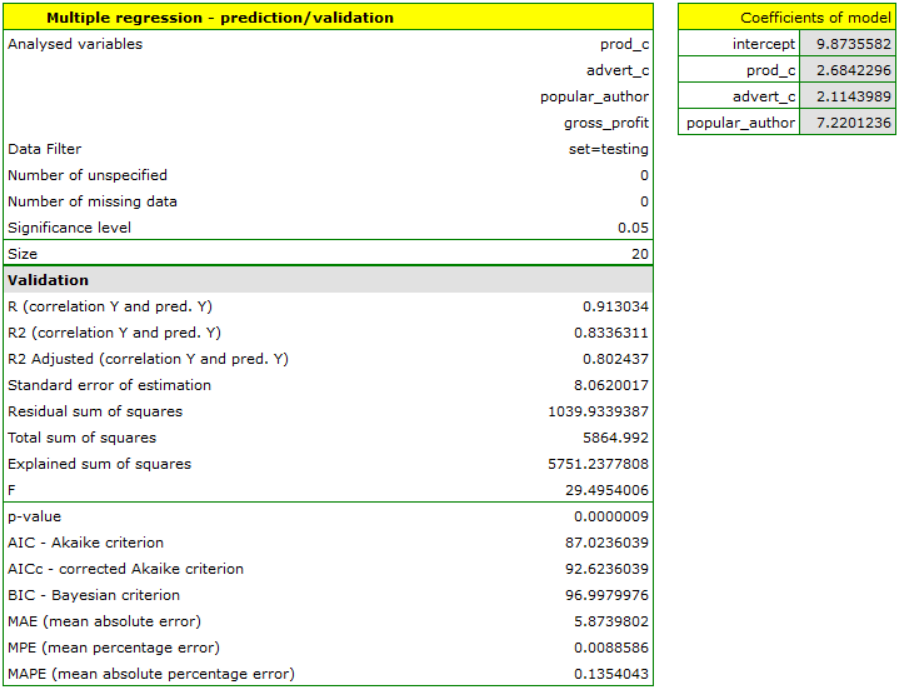
For the test set, the values describing the quality of the model fit are slightly lower than for the learning set: Adjusted = 0.80 and the mean error of prediction (MAE) is 5.9 thousand dollars. Since the validation result on the test set is almost as good as on the training set, we will use the model for prediction. To do this, we will use the data of three new book items added to the end of the set. We'll select Prediction, set filter on the new dataset and use our model to predict the gross profit for these books.
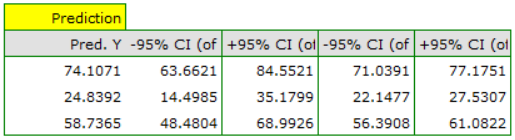
It turns out that the highest gross profit (between 64 and 85 thousands of dollars) is projected for the first, most advertised and most expensive book published by a popular author.
en/statpqpl/wielowympl/wielorpl/predpl.txt · ostatnio zmienione: 2023/04/01 18:24 przez admin
Narzędzia strony
Wszystkie treści w tym wiki, którym nie przyporządkowano licencji, podlegają licencji: CC Attribution-Noncommercial-Share Alike 4.0 International
