Narzędzia użytkownika
Narzędzia witryny
Pasek boczny
en:statpqpl:porown2grpl:parpl:t_testcochranpl
The t-test with the Cochran-Cox adjustment
The Cochran-Cox adjustment relates to the t-test for independent groups (1957)1) and is calculated when variances of analysed variables in both populations are different.
The test statistic is defined by:

The test statistic has the t-Student distribution with degrees of freedom proposed by Satterthwaite (1946)2) and calculated using the formula:

The settings window with the t- test for independent groups can be opened in Statistics menu→Parametric tests→t-test for independent groups or in ''Wizard''.
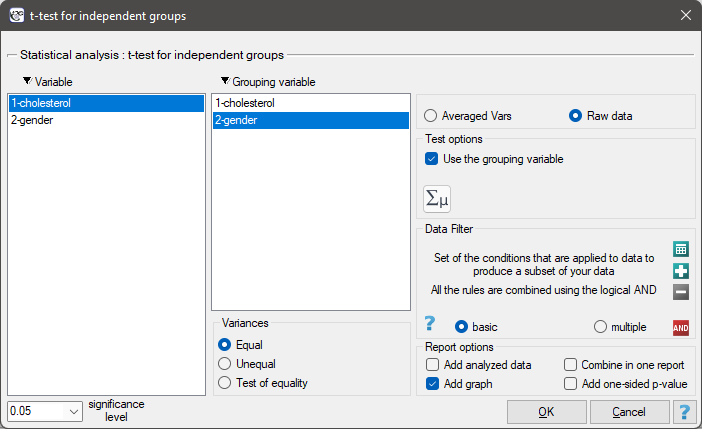
If, in the window which contains the options related to the variances, you have choosen:
equal, the t-test for independent groups will be calculated ,different, the t-test with the Cochran-Cox adjustment will be calculated,check equality, to calculate the Fisher-Snedecor test, basing on its result and set the level of significance, the t-test for independent groups with or without the Cochran-Cox adjustment will be calculated.
Note Calculations can be based on raw data or data that are averaged like: arithmetic means, standard deviations and sample sizes.
en/statpqpl/porown2grpl/parpl/t_testcochranpl.txt · ostatnio zmienione: 2022/02/11 20:38 przez admin
Narzędzia strony
Wszystkie treści w tym wiki, którym nie przyporządkowano licencji, podlegają licencji: CC Attribution-Noncommercial-Share Alike 4.0 International
