Narzędzia użytkownika
Narzędzia witryny
Pasek boczny
en:statpqpl:porown2grpl:parpl:snedecpl
The Fisher-Snedecor test
The F-Snedecor test is based on a variable  which was formulated by Fisher (1924), and its distribution was described by Snedecor. This test is used to verify the hypothesis about equality of variances of an analysed variable for 2 populations.
Basic assumptions:
- measurement on an interval scale,
- normality of distribution of an analysed feature in both populations,
Hypotheses:

where:
 ,
,  – variances of an analysed variable of the 1st and the 2nd population.
The test statistic is defined by:

where:
 ,
,  – variances of an analysed variable of the samples chosen randomly from the 1st and the 2nd population.
The test statistic has the F Snedecor distribution with  and
and  degrees of freedom.
The p-value, designated on the basis of the test statistic, is compared with the significance level  :
:

The settings window with the Fisher-Snedecor test can be opened in Statistics menu→Parametric tests→F Fisher Snedecor.
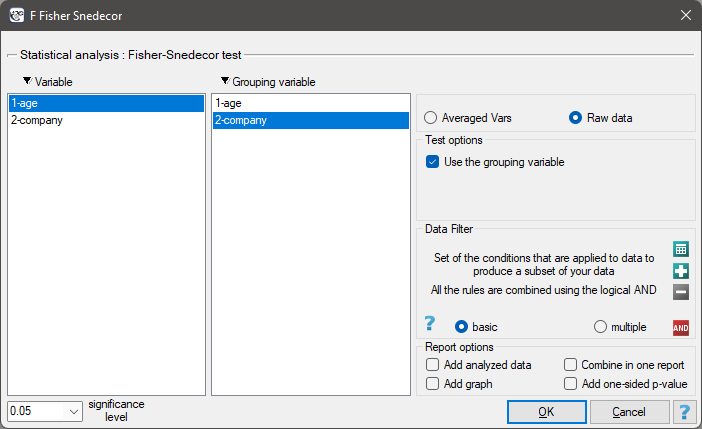
Note
Calculations can be based on raw data or data that are averaged like: arithmetic means, standard deviations and sample sizes.
en/statpqpl/porown2grpl/parpl/snedecpl.txt · ostatnio zmienione: 2022/02/11 20:19 przez admin
Narzędzia strony
Wszystkie treści w tym wiki, którym nie przyporządkowano licencji, podlegają licencji: CC Attribution-Noncommercial-Share Alike 4.0 International
