Narzędzia użytkownika
Narzędzia witryny
Pasek boczny
en:statpqpl:plotpl:bladpl
Bland-Altman plot
As noted by Bland and Altman (19861), 19992)) in clinical medicine, measurements made on the living body are constantly changing and their true value is unknown (e.g., blood pressure), necessitating constant refinement and development of new and better tools to measure them. Usually, when a new method is created, its results are compared with another recognized method, the so-called gold standard. For this purpose, the compatibility of the new method with the previously used method is examined. Of course, the new method cannot be expected to give exactly the same result as the method used so far, but the researcher is interested to see how the results differ. To replace an old method with a new one, the difference between the results of the two methods should be small enough not to pose a problem in clinical interpretation. For example, in a blood pressure measurement, a difference of 20mmHg will be so large that it cannot be considered an acceptable error because it may change the treatment decision. Statistical methods will not answer the question of how large a difference in methods is permissible for the methods to be considered compatible, but appropriate graphical illustration of the differences obtained and the possible limits of variability will help the researcher in making a decision.
A Bland-Altman plot is a point plot, where:
- X axis - average of measurements for compared methods;
- Y axis - difference between measurements for compared methods;
- Mean difference- If the results obtained by the new method are consistently greater / less than the old method, then there is a shift, which is called bias, i.e. the line representing the average difference is not at 0, but is shifted significantly up or down from this level.
- 95% limits of agreement- if the differences have a normal distribution, 95% of the differences will be in the range (Mean difference
 1.96SD), where SD, is the standard deviation of the differences.
Note1
The compliance interval defined above is not the same as the limits of agreement.
Note2
There is no requirement that the data have a normal distribution, only that the distribution of differences does not deviate significantly from the normal distribution. We can check if the differences have a normal distribution by using tests that test for conformity to a normal distribution or a visual interpretation of the normal distribution.
Precision of the limits of agreement - is the interval for the limits, and thus the range of accuracy with which we determine the limits based on a representative sample. The larger the sample and the smaller the variance of the differences, the higher the precision obtained.
EXAMPLE (preassure guage.pqs file)
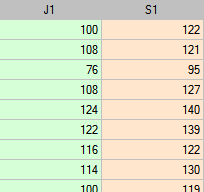
The example is taken from the work of Bland and Altman (19993)). In this study, a semi-automatic blood pressure monitor (S) was compared with the previously traditionally used classic blood pressure monitor (J). For this purpose, systolic blood pressure was measured for 85 patients using both blood pressure monitors. An excerpt of the data is shown below.
A Bland-Altman plot of the collected data indicates that the semi-automatic (S) monitor yields higher results than the classic monitor by an average of 16.3mmHG (the line for the mean difference is 16.3 lower than the absolute agreement shown by the level 0 line). The span of the agreement interval is as high as 76.9mmHG.
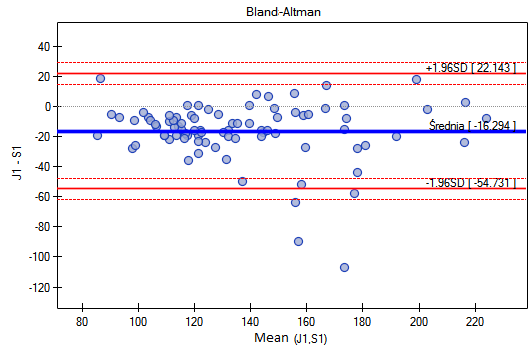
For people with hypertension (systolic pressure  140), the changes in pressure can be quite large, so the tested measurement differences can be distorted by actual pressure spikes, so we extracted a subgroup of people with normal pressure and hypertension based on the average pressure value. For each subgroup, we can plot separately by setting a multiple filter for the variable group in the test window. The agreement of the methods for people with normal blood pressure will then be much improved (narrower agreement interval).
Bland-Altman plot for repeated measurements
Repeatability of measurements is an important but often overlooked aspect in method agreement testing. A method with higher repeatability is more precise. If the measurements of one of the compared methods are not repeatable (i.e. repeated measurements made on the same objects give rather different results), its agreement with the other method will be low. If the repeatability of both methods is poor, their agreement will be even lower. Consequently, when the repeatability of the old method is poor, the agreement of the new method may be poor, even if the new method has high repeatability. Therefore, although in real research a single measurement is taken for each subject (patient), in research aimed at estimating agreement it is recommended to take measurements several times. This approach provides an opportunity to take into account the reproducibility of the results obtained in studies on agreement of methods.
Note
By repeated measurements we mean measurements performed independently on the same objects under the same conditions.
EXAMPLE continued (preassure guage.pqs file)
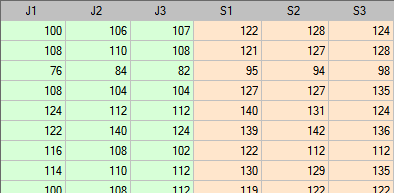
In the comparison of the agreement between the measurements taken by the compared blood pressure monitors, the repeatability of both methods was also taken into account. Therefore, the study was repeated two more times and finally 3 measurements were obtained for each patient using a semi-automatic blood pressure monitor and 3 measurements were obtained using a classic blood pressure monitor. A portion of the data is presented below.
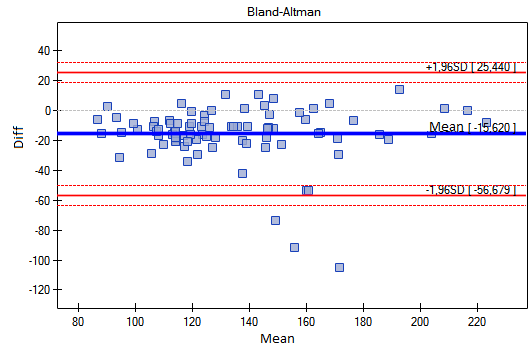
This time, the agreement intervals are slightly wider than when using a single measurement for each method - the span of the agreement interval is as high as 82.11mmHG. This is because we take into account the degree of repeatability of the measurements. Unfortunately, taking several repetitions into account increases the width of the interval, but the presented results better represent reality. Without taking into account the repeatability, we assume that the repeatability is 100 percent, which is almost impossible under real conditions.
As before, it is recommended to repeat the analysis separately for those with hypertension and those with normal blood pressure.
en/statpqpl/plotpl/bladpl.txt · ostatnio zmienione: 2022/02/11 12:08 przez admin
Narzędzia strony
Wszystkie treści w tym wiki, którym nie przyporządkowano licencji, podlegają licencji: CC Attribution-Noncommercial-Share Alike 4.0 International
