Narzędzia użytkownika
Narzędzia witryny
Pasek boczny
en:statpqpl:diagnpl:rocporpl
ROC curves comparison
Very often the aim of studies is the comparison of the size of the area under the ROC curve ( ) with the area under another ROC curve (
 ). The ROC curve with a greater area usually allows a more precise classification of objects.
Methods for comparing the areas depend on the model of the study.
). The ROC curve with a greater area usually allows a more precise classification of objects.
Methods for comparing the areas depend on the model of the study.
- Dependent model – the compared ROC curves are constructed on the basis of measurements made on the same objects.
Hypotheses:

The test statistics has the form presented below:

where:
, and the standard error of the difference in areas  are calculated on the basis of the nonparametric method proposed by DeLong (DeLong E.R. et al., 19881), Hanley J.A., and Hajian-Tilaki K.O. 19972))
Statistics  has (for large sizes) asymptotic normal distribution.
The p-value, designated on the basis of the test statistic, is compared with the significance level  :
:

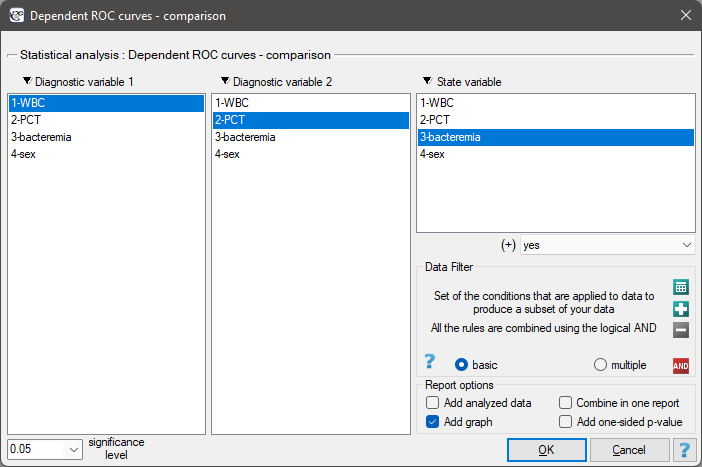
The window with settings for comparing dependent ROC curves is accessed via the menu Advanced statistics → Diagnostic tests → Dependent ROC Curves – comparison.
- Independent model – the compared ROC curves are constructed on the basis of measurements made on different objects.
Hypotheses:
Test statistics (Hanley J.A. and McNeil M.D. 19833)) has the form:

where:
, and standard errors of areas  ,
,  are calculated on the basis of:
- nonparametric method DeLong (DeLong E.R. et al. 1988(DeLong E.R., DeLong D.M., Clarke-Pearson D.L., (1988), Comparing the areas under two or more correlated receiver operating curves: A nonparametric approach. Biometrics 44:837-845)), Hanley J.A., and Hajian-Tilaki K.O. 19974)) - recommended,
- nonparametric Hanley-McNeil method (Hanley J.A. and McNeil M.D. 19825)),
- method which presumes double negative exponential distribution (Hanley J.A. and McNeil M.D. 1982\cite{hanley_mcn}) - computed only when groups (+) and (–) are equinumerous.
Statistics has (for large sizes) asymptotic normal distribution.
The p-value, designated on the basis of the test statistic, is compared with the significance level :
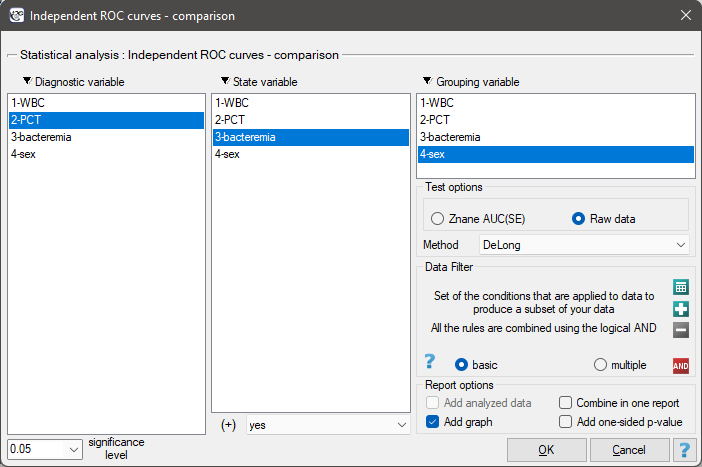
The window with settings for comparing independent ROC curves is accessed via the menu Advanced statistics→Diagnostic tests→Independent ROC Curves – comparison
EXAMPLE cont. (bacteriemia.pqs file)
We will make 2 comparisons:
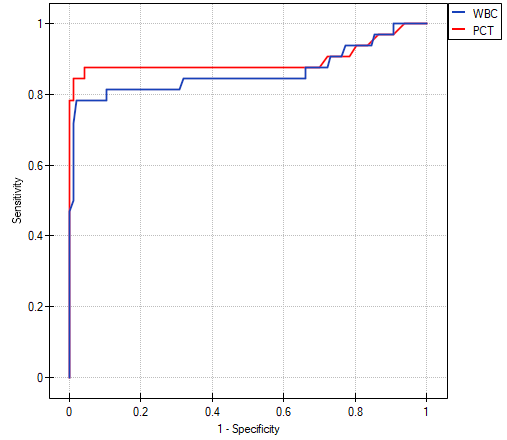
- 1) We will construct 2 ROC curves to compare the diagnostic value of parameters WBC and PCT;
- 2) We will construct 2 ROC curves to compare the diagnostic value of PCT parameter for boys and girls.
- ad1)
Both parameters, WBC and PCT, are stimulants (in bacteremia their values are high). In the course of the comparison of the diagnostic value of those parameters we verify the following hypotheses:

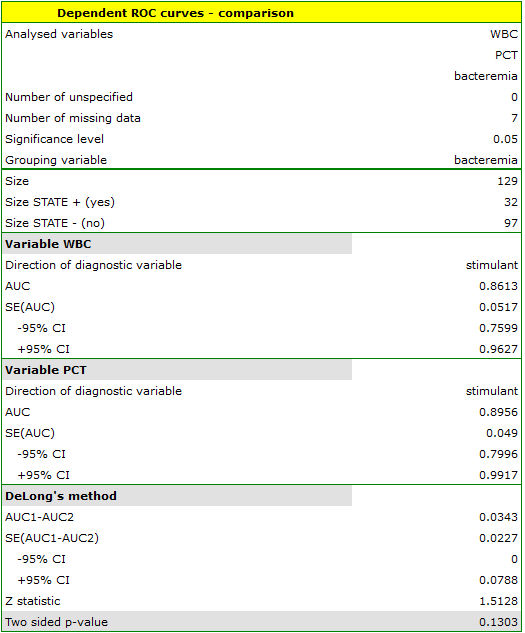
The calculated ares are  ,
,  . On the basis of the adopted level
  , based on the obtained value
  =0.13032 we conclude that we cannot determine which of the parameters: WBC or PCT is better for diagnosing bacteremia.
- ad2) PCT parameter is a stimulant (its value is high in bacteremia). In the course of the comparison of its diagnostic value for girls and boys we verify the following hypotheses:

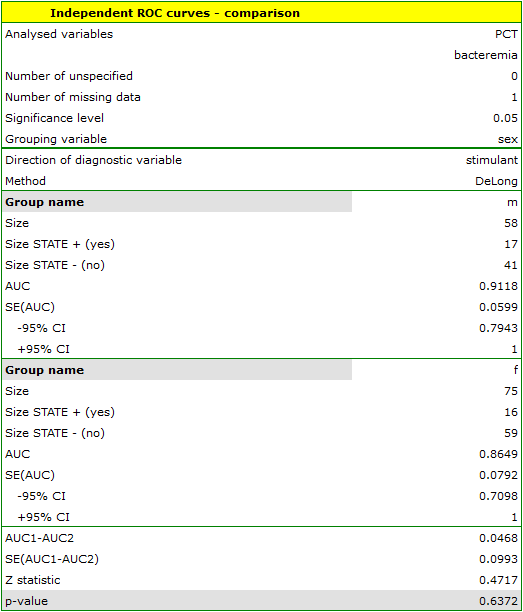
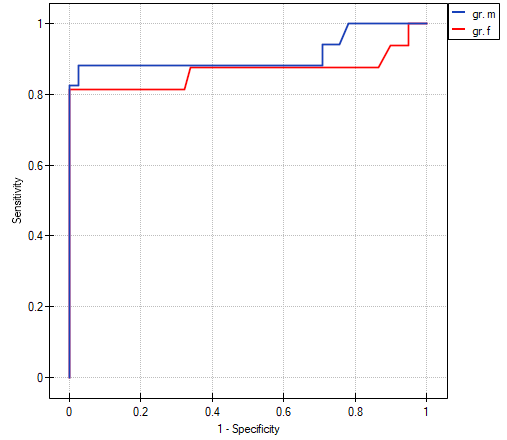
The calculated areas are  ,
,  . Therefore, on the basis of the adopted level , based on the obtained value =0.6372 we conclude that we cannot select the sex for which PCT parameter is better for diagnosing bacteremia.
1)
DeLong E.R., DeLong D.M., Clarke-Pearson D.L., (1988), Comparing the areas under two or more correlated receiver operating curves: A nonparametric approach. Biometrics 44:837-845
2)
, 4)
Hanley J.A. i Hajian-Tilaki K.O. (1997), Sampling variability of nonparametric estimates of the areas under receiver operating characteristic curves: an update. Academic radiology 4(1):49-58
3)
Hanley J.A. i McNeil M.D. (1983), A method of comparing the areas under receiver operating characteristic curves derived from the same cases. Radiology 148: 839-843
5)
Hanley J.A. i McNeil M.D. (1982), The meaning and use of the area under a receiver operating characteristic (ROC) curve. Radiology 143(1):29-36
en/statpqpl/diagnpl/rocporpl.txt · ostatnio zmienione: 2022/02/15 16:46 przez admin
Narzędzia strony
Wszystkie treści w tym wiki, którym nie przyporządkowano licencji, podlegają licencji: CC Attribution-Noncommercial-Share Alike 4.0 International
