Narzędzia użytkownika
Narzędzia witryny
Pasek boczny
en:statpqpl:aopisowapl:tabliczpl:raptabpl
Table report
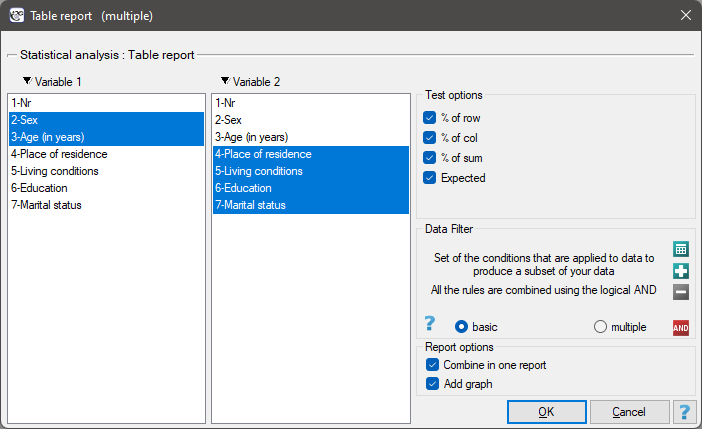
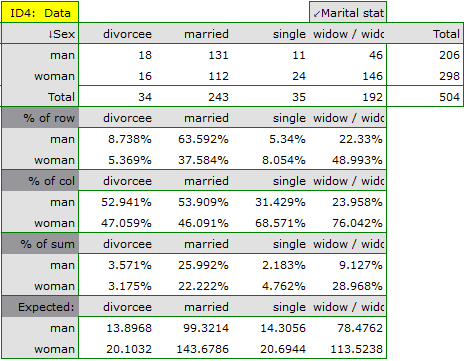
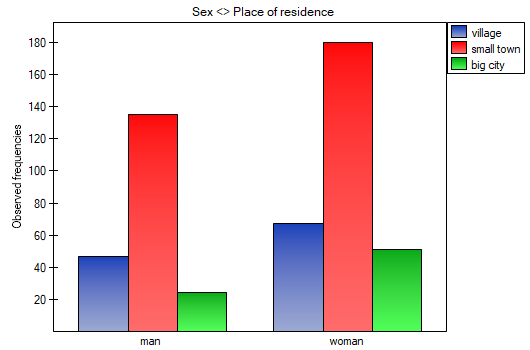
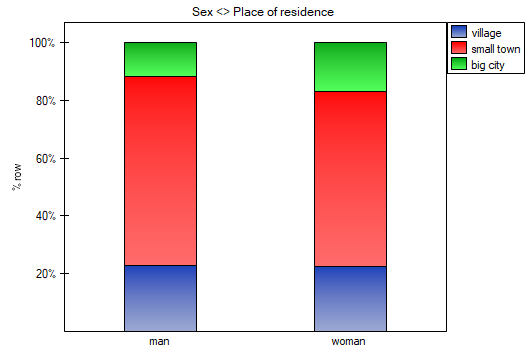
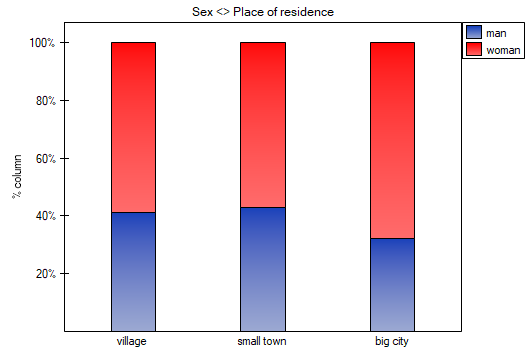
Using a table report, you can prepare a simultaneous summary of a large amount of data in the form of bivariate tables (tables of two features). For example, we can present the distribution of age groups by place of residence, education, etc. in the form of a table. Each table is presented in the form of frequency in particular categories, and additionally, it can be summarized by calculating percentages from a row, from a column, or from the total sum, and determining the frequency table expected. In addition, automatic summaries in the form of a column chart are possible for such tables.
The window with the table report settings is opened via menu Statistics→Descriptive analysis→Table report
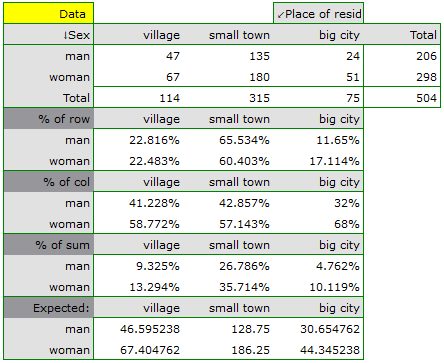
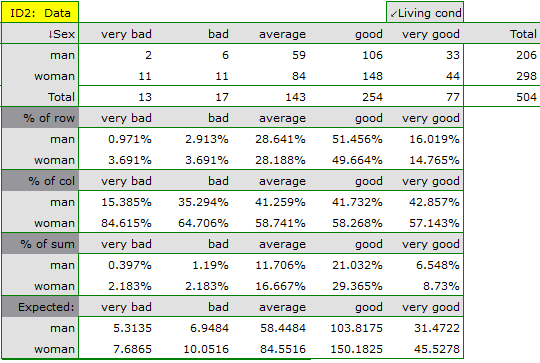
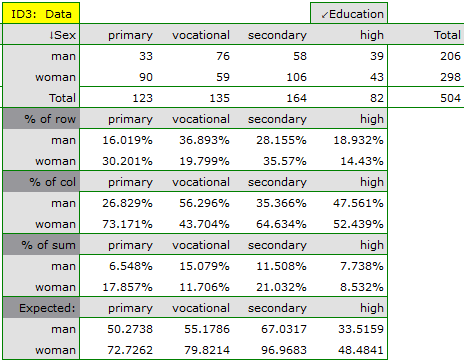
In the form of tables, we need to summarize the distribution of gender by place of residence, social and living conditions, education, marital status, and the distribution of age groups with respect to the same characteristics. This will result in 4 tables for each pair of traits, or 8 tables for all pairs and corresponding graphs. Only the distribution with respect to gender is presented below:

For the distribution with respect to age groups, age categories were first created through codes/labels/format.
en/statpqpl/aopisowapl/tabliczpl/raptabpl.txt · ostatnio zmienione: 2022/02/10 22:07 przez admin
Narzędzia strony
Wszystkie treści w tym wiki, którym nie przyporządkowano licencji, podlegają licencji: CC Attribution-Noncommercial-Share Alike 4.0 International
