Narzędzia użytkownika
Narzędzia witryny
Pasek boczny
en:statpqpl:usepl:arkpl:probkowaniepl
Sampling simulation
 The sampling window is opened via
 Data→Sampling simulation …
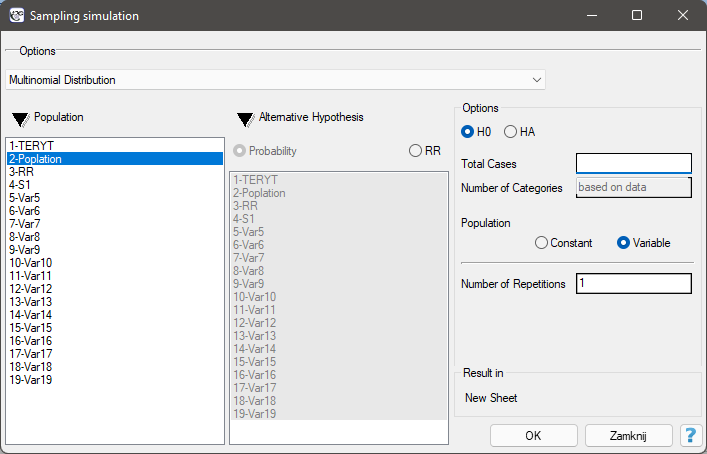
Sampling simulation is a way of generating multinomial distribution data. It involves assigning a given number of cases to categories, in a user-specified manner. The generated data is returned in a new datasheet. The generation can be repeated, so that the datasheet will have many generated columns depending on the number of repetitions of this operation set in the sampling window.
Options:
- H0 - the null hypothesis assumes an even distribution of all cases across categories.
- HA - the alternative hypothesis assumes an uneven distribution of cases. Selecting this option requires indicating categories with higher probability or relative risk. Information about the defined probability or relative risk for each category should be entered into the selected datasheet column prior to conducting the analysis.
Probability should be defined as a value between 0 and 1, with the sum of the probabilities given for all categories being 1.
Relative Risk defines risk relative to other categories and is a value greater than 1 for the increased risk category and a fraction less than 1 for the reduced risk category.
Setting the probability or relative risk values to the same level for all categories, is the same as the distribution for H0.
- Constant population - assumes that the user is interested in distributing the cases according to the proposed distribution.
- Variable population - assumes that the user is interested in distributing the cases such that the proportion of cases to the population is distributed according to the proposed distribution.
EXAMPLE (simulations.pqs file)
As a basis for the simulation, the population of Wielkopolska in 2013 was used, which according to the CSO was  = 3467016 people. The voivodeship is divided into 315 municipalities. The municipalities differ significantly in the number of inhabitants. The most populous municipality (the capital of the province) 548028 inhabitants, the least populous 1454 inhabitants, the median and quartiles are respectively: 6298 (4462; 9621) inhabitants. Assuming that in 2013 there were 6934 residents of the voivodeship with disease X, it is necessary to simulate the distribution of the sick people in such a way as to obtain:
- Random distribution (based on data from the „Random” datasheet)
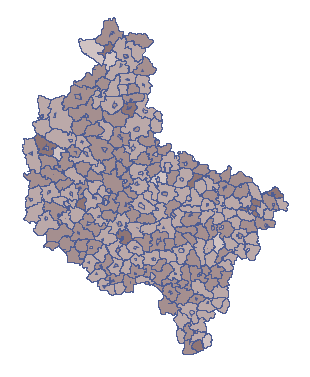
- Four times higher disease frequency in the indicated municipalities than in the rest of the voivodeship (based on data from the „Clusters” datasheet)
- [Ref 1.]
It should be noted that an uniform random distribution of 6934 patients does not imply a similar number of patients in each municipality. It is known that municipalities with a larger number of those at risk should have a corresponding larger number of patients than those with a smaller population. It is therefore of interest to distribute the patients in such a way that the ratio of patients to population is relatively constant. This implies accepting the null hypothesis H0 and the population variable. The number of individual municipalities was recorded in a column named: population.
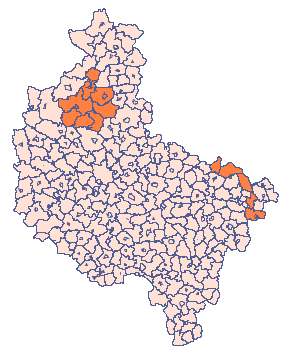
The data drawn based on these assumptions are presented in the first column of the new datasheet. To be able to observe the random distribution of illness rates across municipalities, copy the resulting data into the „Random” datasheet of column „S1”. The formula in column 7 will then be recalculated (you can view and change the formula by setting Codes/Labels/Format in the column properties). On the map, the result is shown using the Map manager  from the Spatial Analysis menu. The proportion of patients to population in each municipality is then plotted. An example of the result is shown on the map below.
- [Ref 2.]
In the „Clusters” datasheet, as in the previous task, the frequency for the study population is given. This time the higher frequency is expected in some municipalities (indicated on the map), so in addition, in the next column of the datasheet, the value of the relative risk for individual municipalities is presented, setting it to 4, for municipalities with increased risk and 1 for the remaining municipalities.
Appropriate sampling requires that you select the alternative hypothesis HA (by selecting the relative risk column) and the population variable (by indicating the population size column of the municipalities). The data drawn under these assumptions are presented in the first column of the new datasheet.
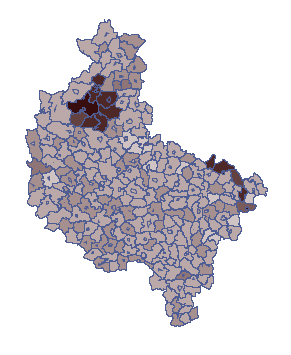
To be able to observe the distribution of the coefficient, assuming greater risk in the indicated municipalities, copy the result obtained to the datasheet „Clusters” column „S1”. The formula in column 7 will then be recalculated. On the map, the obtained result is presented using the Map manager from the Spatial Analysis menu. The proportion of ill people to population in each municipality is then plotted. An example of the result is shown on the map below.
en/statpqpl/usepl/arkpl/probkowaniepl.txt · ostatnio zmienione: 2022/02/10 20:29 przez admin
Narzędzia strony
Wszystkie treści w tym wiki, którym nie przyporządkowano licencji, podlegają licencji: CC Attribution-Noncommercial-Share Alike 4.0 International
