Narzędzia użytkownika
Narzędzia witryny
Pasek boczny
en:statpqpl:usepl:arkpl:misspl
Missing data
 In research we very often encounter missing data, this is natural in particular for survey data. There are situations in which missing data provides valuable information. For example: the number of missing data items in response to a question about support for political parties gives an idea about the number of undecided people who do not like (or do not admit to liking) certain political groups. Small numbers of missing data are not a problem in statistical analyses. A large number of them, however, may cast doubt on the reliability of the research. It is worth at the very beginning of the work to make sure that there is as little missing data as possible. Of course, it is best to find information about the actual value that should be put in the place of missing data, but this is not always possible.
How missing data are estimated depends primarily on the nature of the data. The program proposes several ways to impute missing data for individual variables.
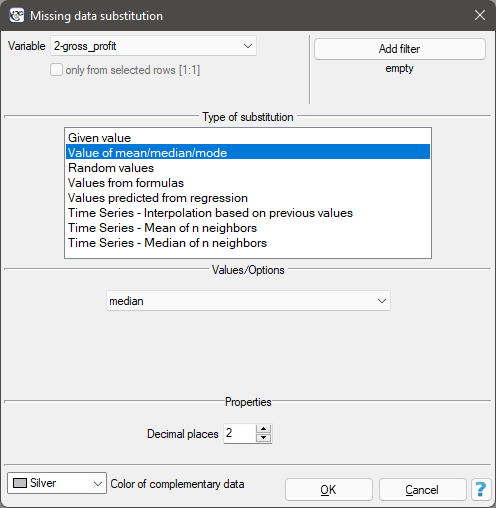
The Missing data substitution settings window accessed via menu Data→Missing data…
- Filling with one value
Selecting one of the following options will replace all missing data in the selected column with the same value:
- specified by the user,
- the arithmetic mean calculated from the data,
- the geometric mean calculated from the data,
- the harmonic mean calculated from the data,
- the median,
- the mode (unless it is multiple).
- Filling with multiple values
Selecting one of the following options will replace the missing data in the selected column with multiple (usually different) values. These values can be predicted from the column for which the missing data is filled, but they can also be predicted from the values of other columns (variables). You can replace missing data with values:
- random from the data;
- random from normal distribution - normal distribution is defined by the mean and standard deviation of the existing data;
- with random values from an interval specified by the user;
- calculated from user functions - this option allows you to use data from other variables to predict the missing value in the selected column;
- predicted from the regression model - this option allows to predict the value of missing data based on the multiple regression model (the functioning of multiple regression is described in the section ''Multiple linear regression'');
- interpolation based on neighboring values - applies to time series - so the user must indicate the time variable indicating the order of data; interpolation involves the determination of values for the missing data in such a way that they are graphically located on the straight line connecting values for data adjacent to the missing data;
- the average of
 neighbors - applies to time series - Thus, the user must indicate the time variable that tells the order of the data; interpolation works by determining the average of the values for neighbors preceding and neighbors immediately following the missing data;
 - median from neighbors - applies to time series - thus the user must indicate the time variable telling about the order of the data; interpolation works by determining the median from the values for neighbors preceding and from neighbors immediately following the missing data;
Note
In order to be able to distinguish between imputed and real data, the replaced spaces are marked with a chosen color.
Example (missingData-publisher.pqs file)
Analysis of the publisher.pqs file with no missing data is discussed in ''Multiple linear regression''. This time we are going to deal with a datasheet in which there are missing data in the column containing gross profit from book sales. For these missing data, the actual values are known (datasheet: „REAL VALUES”), so you can compare the values generated by the program for the missing data with the actual values to compare the results obtained by different techniques. In the example, we will use 2 ways of replacing missing data: replacing with the median value and the value determined by the regression model. The other options are left to you to work on your own.
Replacing missing data with the median value is done on datasheet 1 called „Insert the median”. Set the variable prepared to be inputed as gross profit in the Missing data window and select the method of replacement as the median value. This will result in a value of 46 850 dollars being inputed in place of the missing data.
It is suspected that profits are higher when dealing with books from known authors (coded as 1) and lower when dealing with those from unknown authors (coded as 0). So we calculate the median gross profit separately for books by known and unknown authors. We perform the imputation on the datasheet named „Insert two medians”. We set the filter twice for the variable defining the authors' popularity (variable 7) - once giving the value 1 and once giving the value 0. The resulting median gross profit in the group of books by popular authors is about 51 000 dollars, and among those by lesser-known authors it is about 34 000 dollars.
Another way to replace missing data, is to use a regression model. Select the „Insert from regression” datasheet and once again select the gross profit variable as the variable to be inserted, and select „Values predicted from regression” as the method of substitution. There will be more variables used to predict the value of gross profit this time: production costs (variable 3), advertising costs (variable 4) and authors' popularity (variable 7). This time the results seem to be less different from the real values, unfortunately the result for the item number 35 is missing, because for this book we had no information about the cost of production, on which, among other things, we wanted to base the prediction.
en/statpqpl/usepl/arkpl/misspl.txt · ostatnio zmienione: 2022/02/09 21:06 przez admin
Narzędzia strony
Wszystkie treści w tym wiki, którym nie przyporządkowano licencji, podlegają licencji: CC Attribution-Noncommercial-Share Alike 4.0 International
