przejście do zawartości
PQStat - Baza Wiedzy
English (en)
Polski (pl)
Narzędzia użytkownika
Zaloguj
Narzędzia witryny
Szukaj
Jesteś tutaj:
PQStat - Baza Wiedzy
»
PQStat Knowledge Base
»
PQStat - Statistic
»
Plots
»
Plot gallery
Ślad:
•
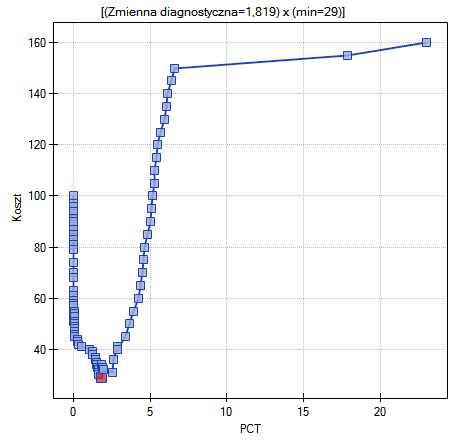
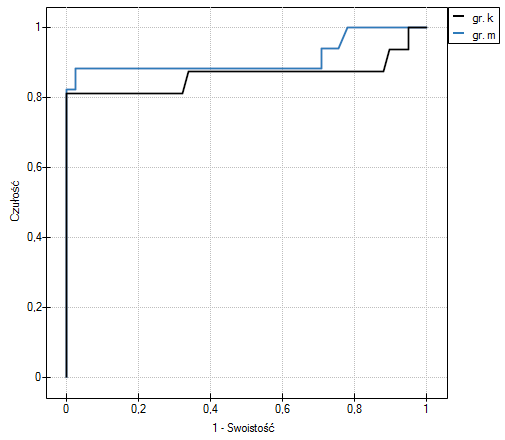
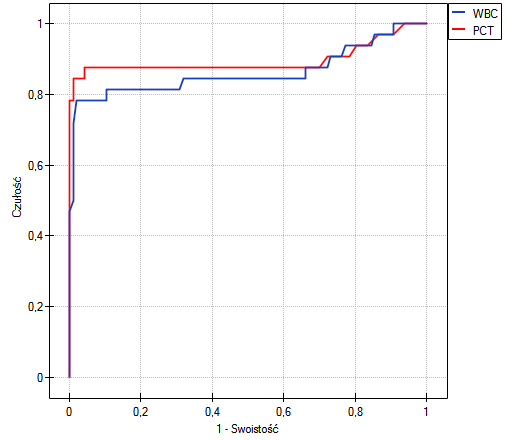
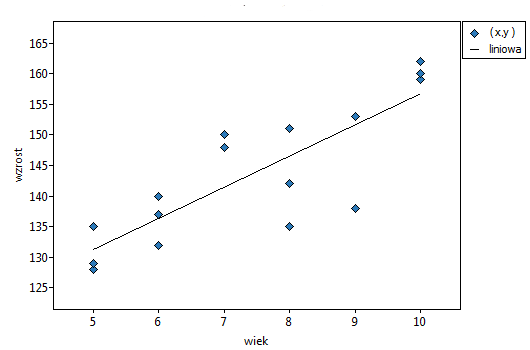
Plot gallery
Pasek boczny
Installation
Program operation
Organization of work with the program
Plots
Test power and sample size
Descriptive analyses
Probability distributions
Hypothesis testing
Normality distribution tests
Comparison - one group
Comparison - two groups
Comparison - more than two groups
Multicomparisons
Univariate MANOVA
Hotelling T-square
Analysis for stratas
Correlation
Agreement analysis
Diagnostics tests
Multidimensional models
Dimension reduction and grouping
Reliability analysis
Survival analysis
Meta-analysis
With Teacher
Spatial analysis - an introduction
Map manager
Spatial weights matrix
Spatial smoothing
Descriptive statistics
Density analysis
Randomness of point distribution
Spatial autocorrelation
Local estimate of spatial clustering
en:statpqpl:plotpl:galpl
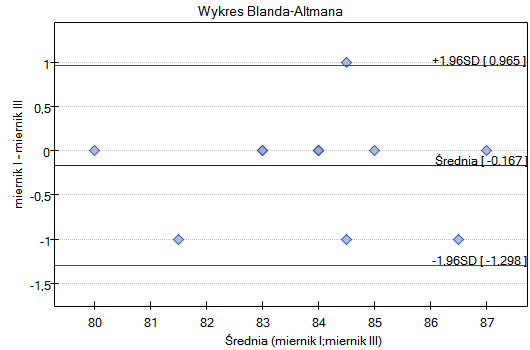
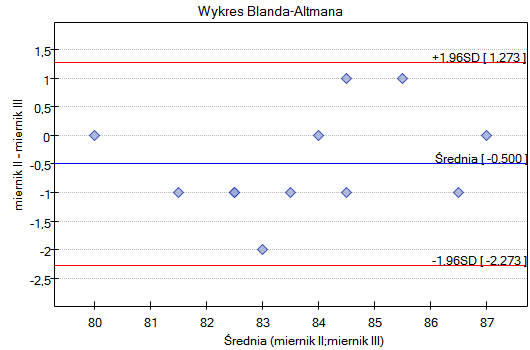
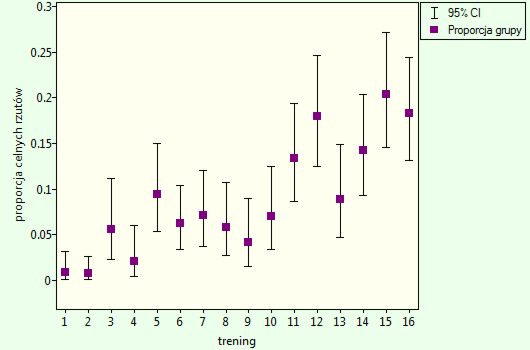
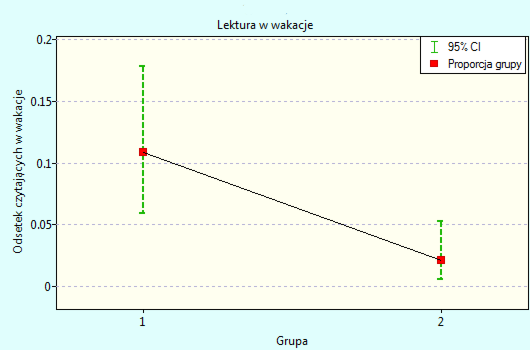
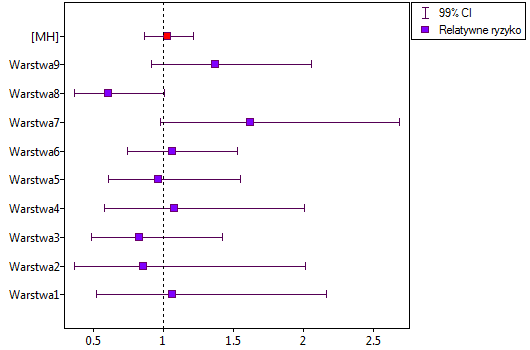
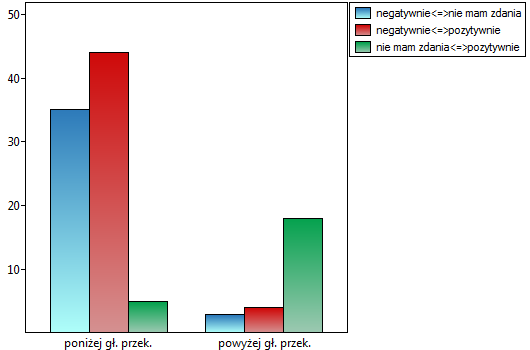
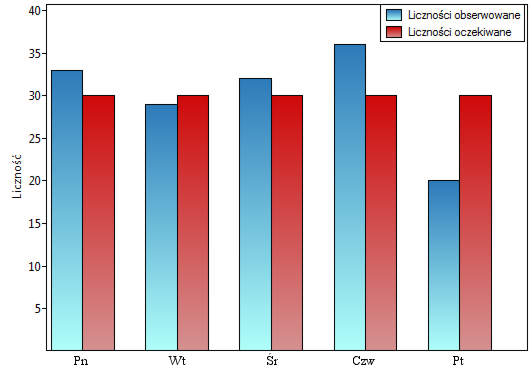
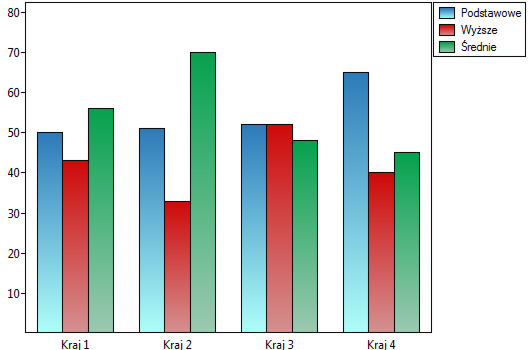
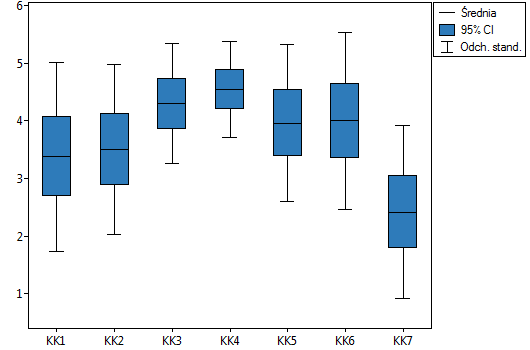
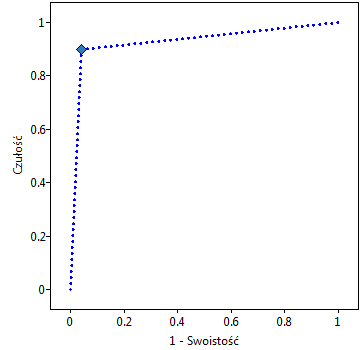
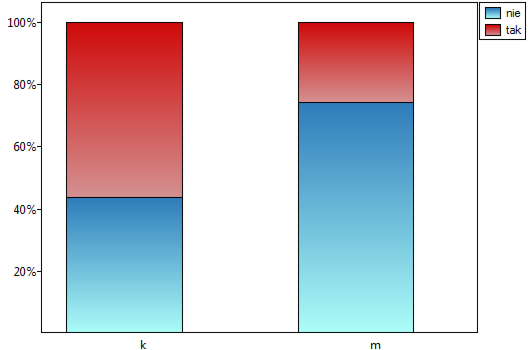
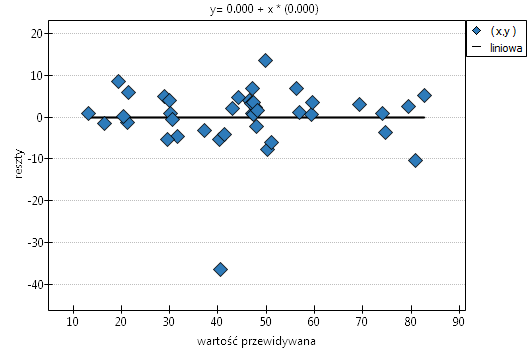
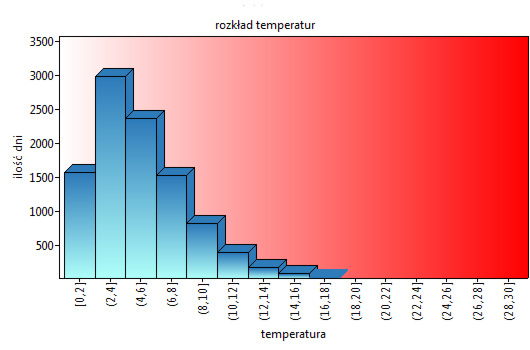
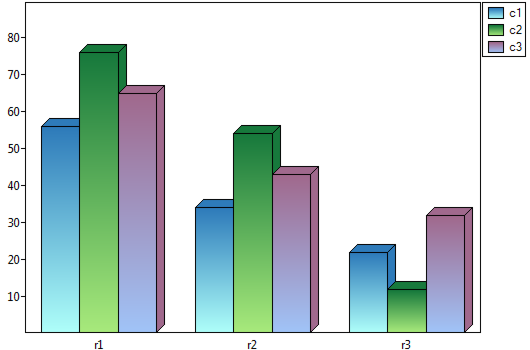
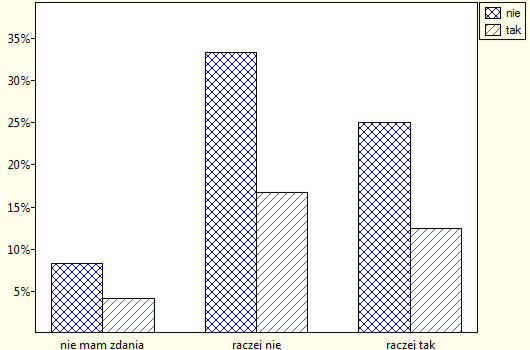
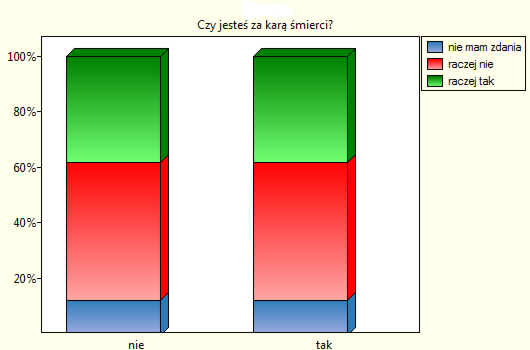
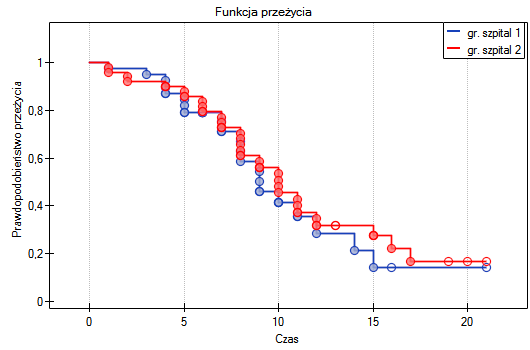
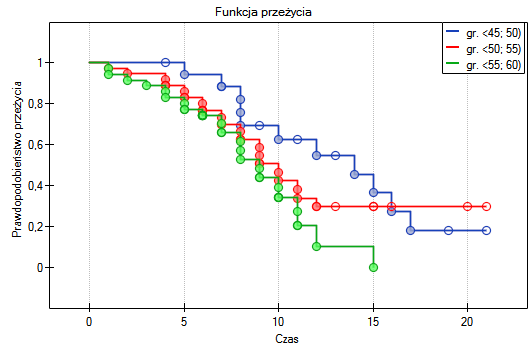
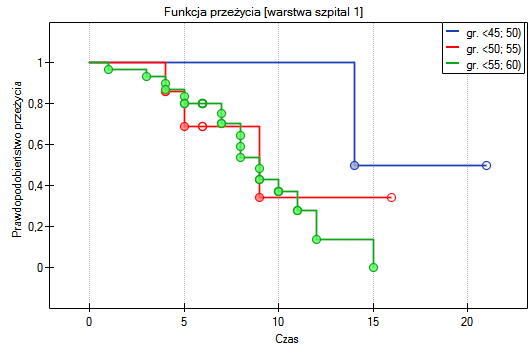
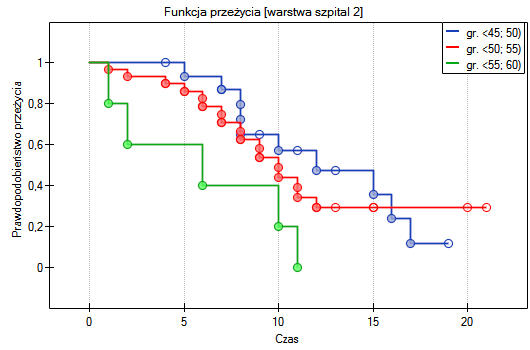
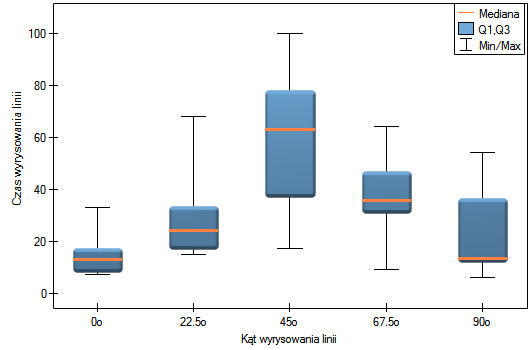
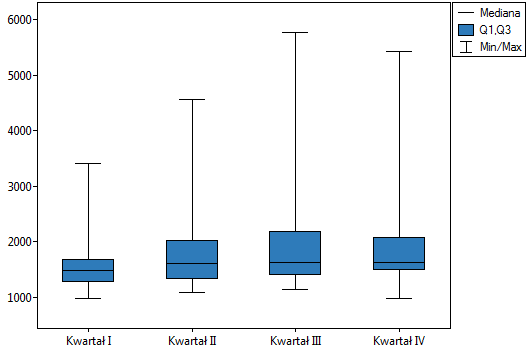
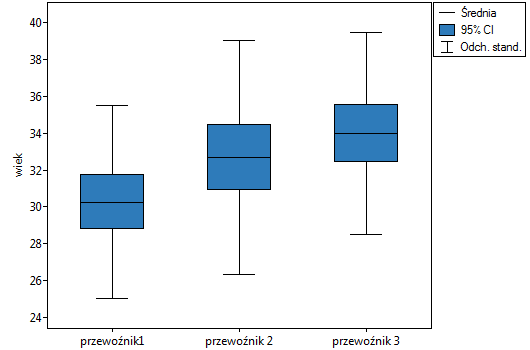
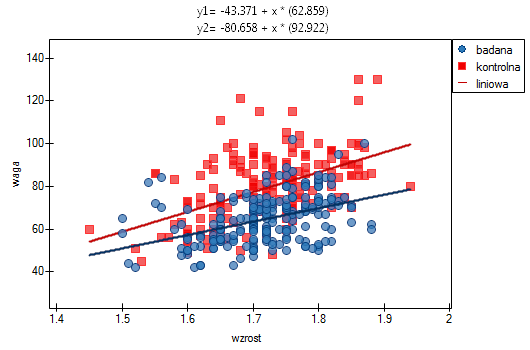
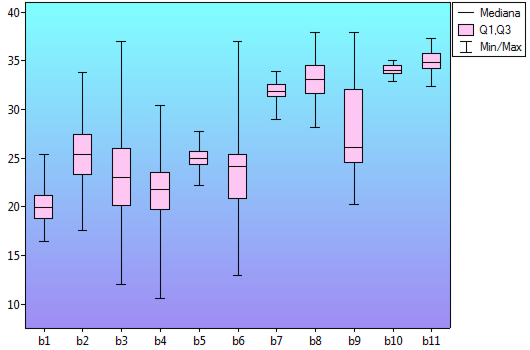
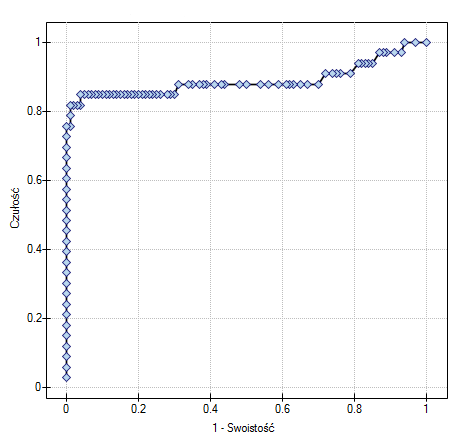
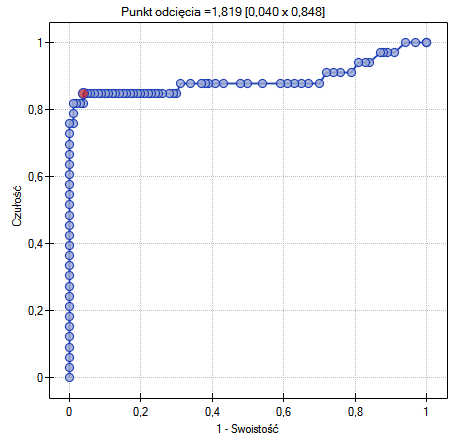
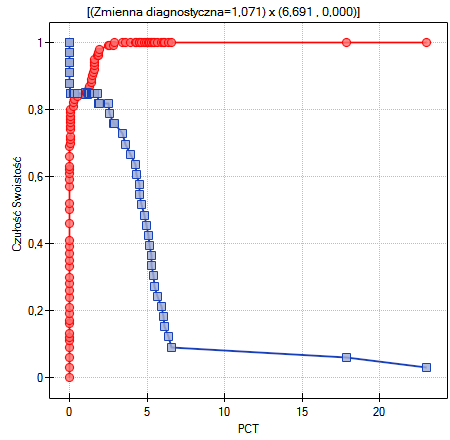
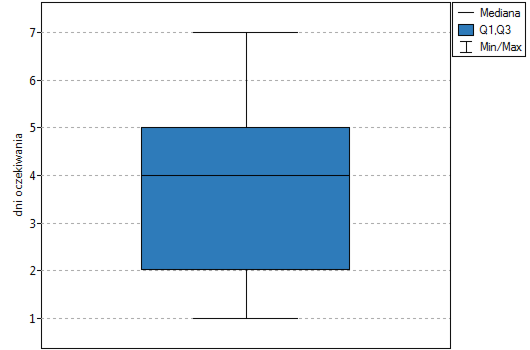
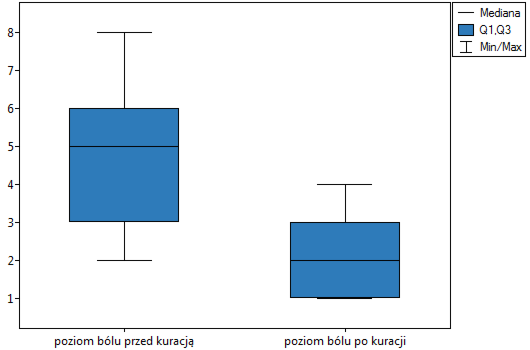
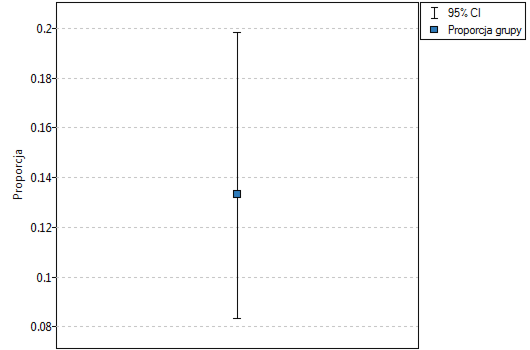
Plot gallery
en/statpqpl/plotpl/galpl.txt
· ostatnio zmienione: 2022/02/09 14:50 przez
admin
Narzędzia strony
Do góry