Narzędzia użytkownika
Narzędzia witryny
Pasek boczny
en:statpqpl:aopisowapl:zestawopispl
Descriptive summaries
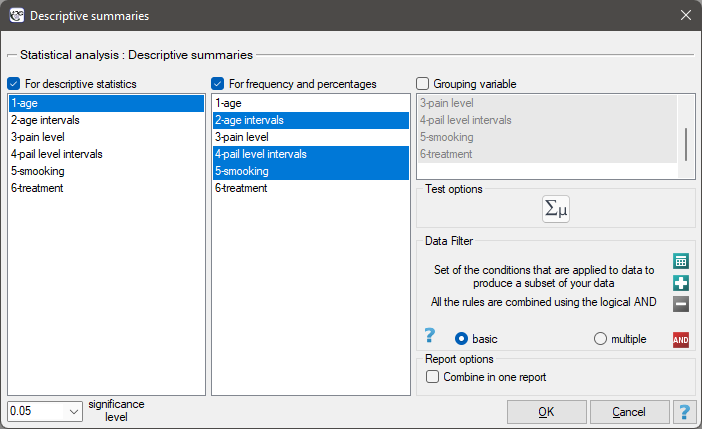
Descriptive summaries are a quick way to prepare a report showing a description of your data that is ready to be inserted directly into a research paper. It is a tool that makes it easy to compile all forms of basic data description in one place.
The Descriptive summaries option settings window is invoked via the menu
textsf{Statistics} menu→Summaries→Descriptive summaries.
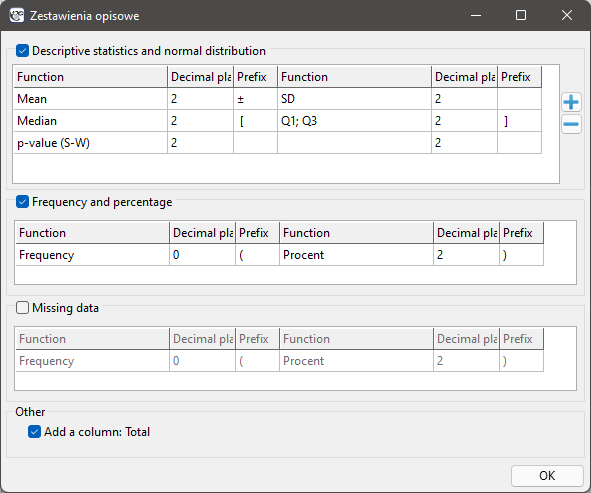
Depending on how we measure, we usually use one of three types of measures to describe a variable:
- mean ± standard deviation, abbreviated

- median [lower quartile; upper quartile], abbreviated
![$Me [Q_1; Q_3]$](/lib/exe/fetch.php?media=wiki:latex:/imge5d523514ddeec43a53ea60959fef1c0.png "LaTeX") or median [min; max], abbreviated
or median [min; max], abbreviated ![$Me [min; max]$](/lib/exe/fetch.php?media=wiki:latex:/img02b6fbfd0a1f0e0e7bc39aae45be6b0a.png "LaTeX")
- the number (percentage) of each category, abbreviated

Depending on the need and fulfillment of additional assumptions
- in the interval scale, data can be described using any measure, in addition, often the researcher wants to check the normality of the distribution of such data,
- in the ordinal scale we have medians (with quartiles or the smallest and the largest value) or counts and percentages of particular categories,
- at the nominal scale, only the counts and percentages of each category.
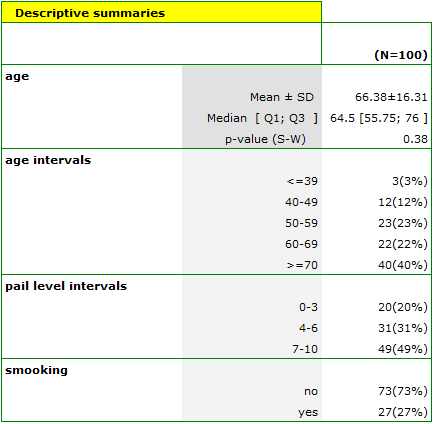
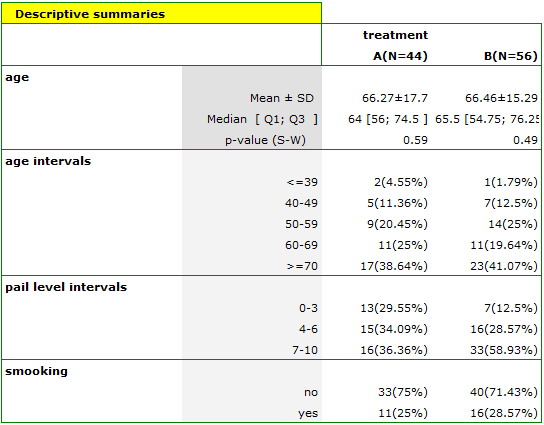
EXAMPLE (Descriptive summaries.pqs file)
An example of how the data are described is shown in the obtained report summarizing age, pain level, and smoking status. These data are summarized in table one describing all 100 subjects and in table two by treatment method.
en/statpqpl/aopisowapl/zestawopispl.txt · ostatnio zmienione: 2023/03/31 22:29 przez admin
Narzędzia strony
Wszystkie treści w tym wiki, którym nie przyporządkowano licencji, podlegają licencji: CC Attribution-Noncommercial-Share Alike 4.0 International
