The Single-Sample Chi-square Test for a Population Variance
Basic assumptions:
- measurement on an interval scale,
- normality of distribution of an analysed feature.
Hypotheses:

where:
 – standard deviation of a characteristic in the population represented by the sample,
 – setpoint.
The test statistic is defined by:

where:
 – standard deviation in the sample,
 – sample size.
The test statistic has the Chi-square distribution with the degrees of freedom determined by the formula:  .
.
The p-value, designated on the basis of the test statistic, is compared with the significance level  :
:

Whereby, if the standard deviation value is less than the setpoint, the  value is calculated as the doubled value of the area under the chi-square distribution curve to the left of the corresponding critical value, and if it is greater than the setpoint, it is the doubled value of the corresponding area to the right.
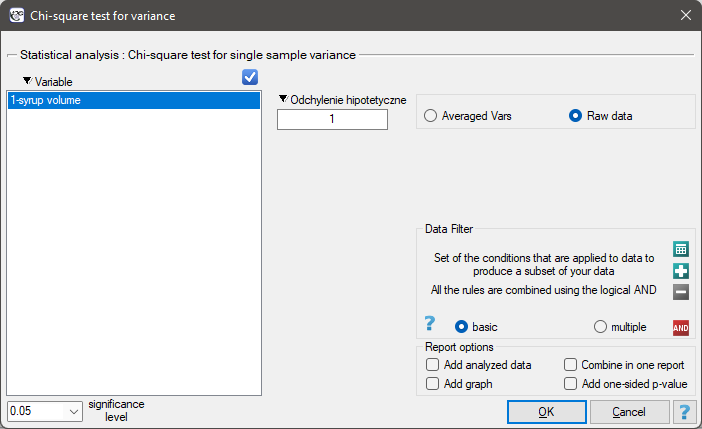
he settings window with the Chi-test for variance w can be opened in Statistics menu→Parametric tests→Chi-square test for variance.
Note
Calculations can be based on raw data or data that are averaged like: standard deviation and sample size.
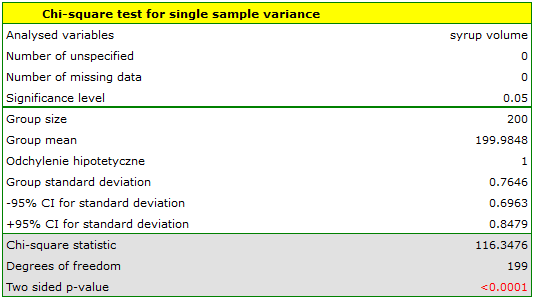
Before starting the production of another batch of a certain cough syrup, control measurements of the volume of syrup poured into the bottles were made. The technical documentation of the dosing device shows that the permissible variation in syrup volume measured by the standard deviation is 1ml. It should be verified that the tested device is working properly.
The distribution of the volume of syrup poured into the bottles was checked (with the Lilliefors test) obtaining a result consistent with this distribution. The analysis concerning the standard deviation can therefore be performed with the chi-square test for variance
Hypotheses:

Comparing the  value of the
  test with the significance level
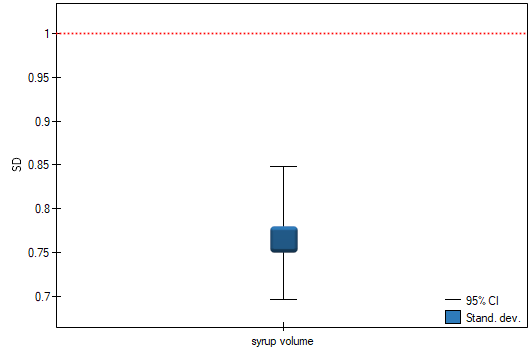
  we find that the scatter of the dispensing device is different from 1ml. However, we can consider the performance of the device as correct because the standard deviation of the sample is 0.76, which is significantly less than the acceptable value from the technical documentation.