The Kappa Fleiss coefficient and a test to examine its significance
This coefficient determines the concordance of measurements conducted by a few judges (Fleiss, 19711)) and is an extension of Cohen's Kappa coefficient, which allows testing the concordance of only two judges. With that said, it should be noted that each of  randomly selected objects can be judged by a different random set of
  judges. The analysis is based on data transformed into a table with
  rows and
  columns, where
  is the number of possible categories to which the judges assign the test objects. Thus, each row in the table gives
  , which is the number of judges making the judgments specified in that column.
The Kappa coefficient ( ) is then expressed by the formula:

where:
 ,
,
 ,
,
 .
.
A value of  indicates full agreement among judges, while
  indicates the concordance that would arise if the judges' opinions were given at random. Negative values of Kappa, on the other hand, indicate concordance less than that at random.
For a coefficient of  the standard error
  can be determined, which allows statistical significance to be tested and asymptotic confidence intervals to be determined.
Z test for significance of Fleiss' Kappa coefficient ( ) (Fleiss, 20032)) is used to test the hypothesis that the ratings of several judges are consistent and is based on the coefficient
  calculated for the sample.
Basic assumptions:
- measurement on a nominal scale – possible category ordering is not taken into account.
Hypotheses:

The test statistic has the form:

The  statistic asymptotically (for large sample sizes) has the normal distribution.
The p-value, designated on the basis of the test statistic, is compared with the significance level  :
:

Note
The determination of Fleiss's Kappa coefficient is conceptually similar to the Mantel-Haenszel method. The determined Kappa is a general measure that summarizes the concordance of all judge ratings and can be determined as the Kappa formed from individual layers, which are specific judge ratings (Fleiss, 20033)). Therefore, as a summary of each layer, the judges' concordance (Kappa coefficient) can be determined summarizing each possible rating separately.
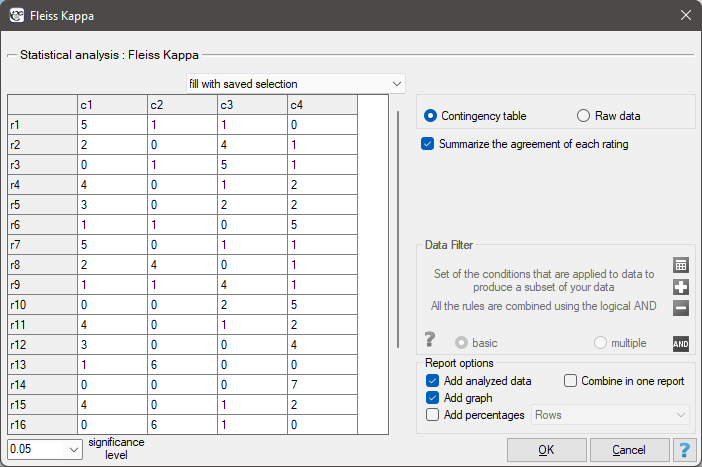
The settings window with the test of the Fleiss's Kappa significance can be opened in Statistics menu →NonParametric tests→Fleiss Kappa.
EXAMPLE (temperament.pqs file)
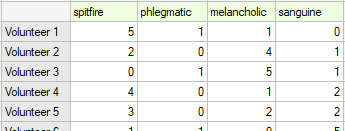
20 volunteers take part in a game to determine their personality type. Each volunteer has a rating given by 7 different observers (usually people from their close circle or family). Each observer has been introduced to the basic traits describing temperament in each personality type: choleric, phlegmatic, melancholic, sanguine. We examine observers' concordance in assigning personality types. An excerpt of the data is shown in the table below.}
Hypotheses:

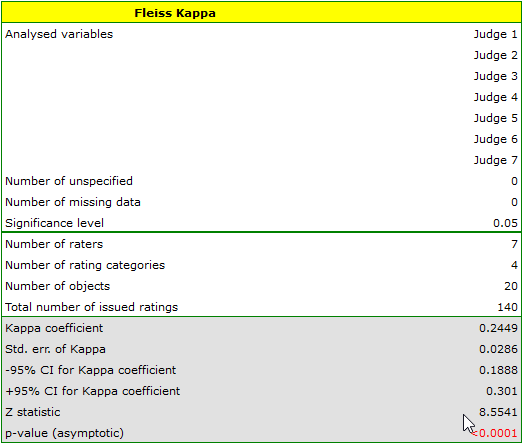
We observe an unimpressive Kappa coefficient = 0.24, but statistically significant (p<0.0001), indicating non-random agreement between judges' ratings. The significant concordance applies to each grade, as evidenced by the concordance summary report for each stratum (for each grade) and the graph showing the individual Kappa coefficients and Kappa summarizing the total.
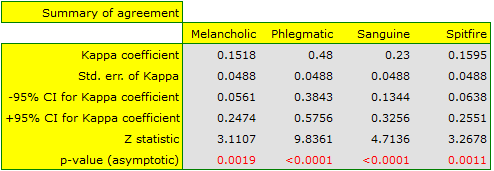
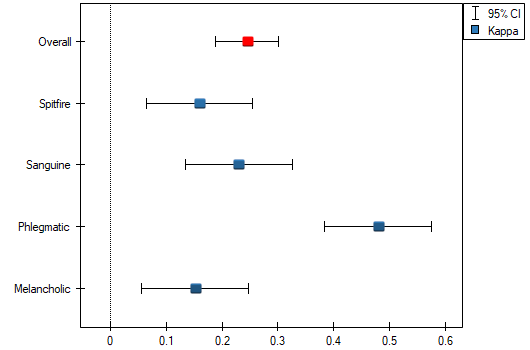
It may be interesting to note that the highest concordance is for the evaluation of phlegmatics (Kappa=0.48).
With a small number of people observed, it is also useful to make a graph showing how observers rated each person.
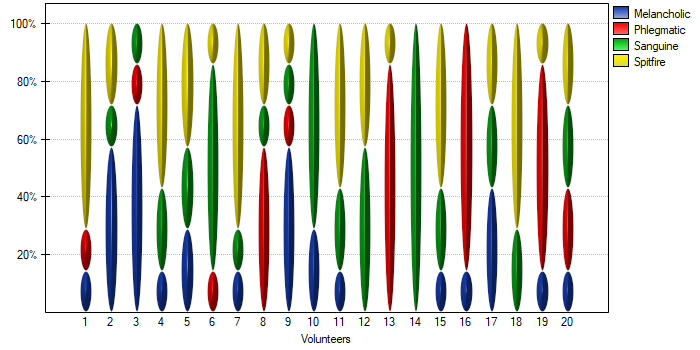
In this case, only person no 14 received an unambiguous personality type rating – sanguine. Person no. 13 and 16 were assessed as phlegmatic by 6 observers (out of 7 possible). In the case of the remaining persons, there was slightly less agreement in the ratings. The most difficult to define personality type seems to be characteristic of the last person, who received the most diverse set of ratings.