The t-test for independent groups
The  -test for independent groups is used to verify the hypothesis about the equality of means of an analysed variable in 2 populations.
Basic assumptions:
- measurement on an interval scale,
- normality of distribution of an analysed feature in both populations,
- equality of variances of an analysed variable in 2 populations.
Hypotheses:

where:
 ,
,  – means of an analysed variable of the 1st and the 2nd population.
The test statistic is defined by:

where:
 – means of an analysed variable of the 1st and the 2nd sample,
 – the 1st and the 2nd sample size,
 – variances of an analysed variable of the 1st and the 2nd sample.
The test statistic has the t-Student distribution with  degrees of freedom.
The p-value, designated on the basis of the test statistic, is compared with the significance level  :
:

Note:
- pooled standard deviation is defined by:

- standard error of difference of means is defined by:

Standardized effect size.
The Cohen's d determines how much of the variation occurring is the difference between the averages.
 .
.
When interpreting an effect, researchers often use general guidelines proposed by Cohen 1) defining small (0.2), medium (0.5) and large (0.8) effect sizes.
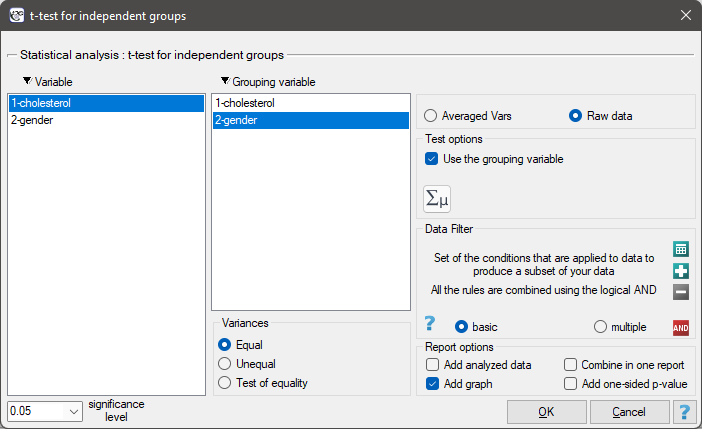
The settings window with the t- test for independent groups can be opened in Statistics menu→Parametric tests→t-test for independent groups or in ''Wizard''.

If, in the window which contains the options related to the variances, you have choosen:
equal, the t-test for independent groups will be calculated ,different, the t-test with the Cochran-Cox adjustment will be calculated,check equality, to calculate the Fisher-Snedecor test, basing on its result and set the level of significance, the t-test for independent groups with or without the Cochran-Cox adjustment will be calculated.
Note
Calculations can be based on raw data or data that are averaged like: arithmetic means, standard deviations and sample sizes.
EXAMPLE (cholesterol.pqs file)
Five hundred subjects each were drawn from a population of women and a population of men over 40 years of age. The study concerned the assessment of cardiovascular disease risk. Among the parameters studied is the value of total cholesterol. The purpose of this study will be to compare men and women as to this value. We want to show that these populations differ on the level of total cholesterol and not only on the level of cholesterol broken down into its fractions.
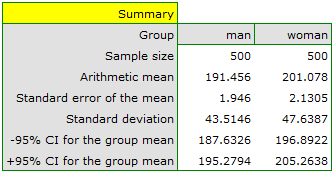
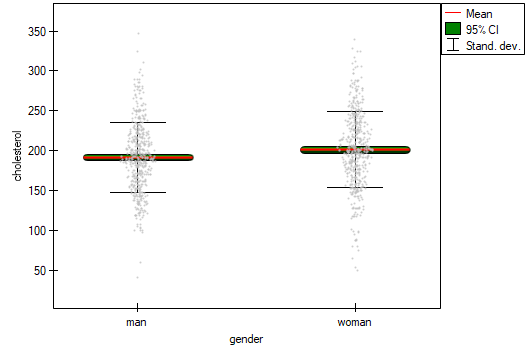
The distribution of age in both groups is a normal distribution (this was checked with the Lilliefors test). The mean cholesterol value in the male group was  and the standard deviation
  , in the female group
  and
and  respectively. The Fisher-Snedecor test indicates small but statistically significant (
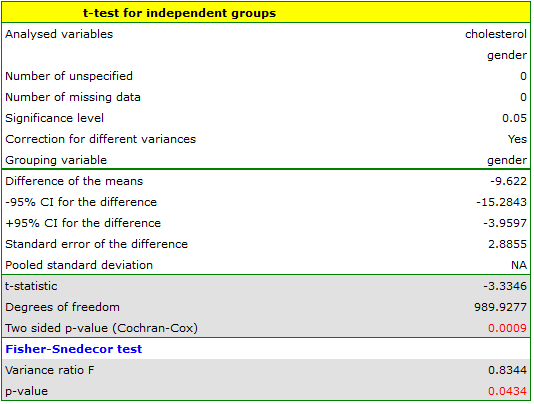
 ) differences in variances. The analysis will use the Student's t-test with Cochran-Cox correction
Hypotheses:


Comparing  with a significance level
  we find that women and men in Poland have statistically significant differences in total cholesterol values. The average Polish man over the age of 40 has higher total cholesterol than the average Polish woman by almost 10 units.