Multivariate normality tests
Many methods of multivariate analysis, including MANOVA, Hotelling tests, or regression models are based on the assumption of multivariate normality. If a set of variables is characterized by a multivariate normal distribution, then each variable can be assumed to have a normal distribution. However, when all individual variables are characterized by a normal distribution, their set does not have to have a multivariate normal distribution. Therefore, testing the unidimensional normality of each variable may be helpful, but cannot be assumed to be sufficient.
Different types of statistical analyses that assume normality are sensitive to different degrees to different types of departure from this assumption. Tests that refer to means in their hypotheses are generally taken as more sensitive to skewness, while tests comparing covariances depend more heavily on kurtosis.
The window with the test of multivariate normality of distribution settings is opened via Statistics→Normality tests→Multi-dimensional normality.

Mardia's test for multivariate normality
The test proposed by Mardia in 1970 1) and modified in 1974 2) tests the normality of a distribution by analyzing separately the magnitude of multivariate skewness and multivariate kurtosis. Jarque and Bera 3) proposed combining these two Mardia measures into a single test. A similar way of combining skewness and kurtosis information into a single test is provided by the method of Hanusz and Tarasinska 4).
Mardia defined multivariate skewness and kurtosis as follows:

where
 ,
,
 ,
,
 -mean,
  - covariance matrix.
For data derived from a sample rather than a population, the formulas for skewness and kurtosis are multiplied respectively: skewness by  and kurtosis by
  .
.
Hypotheses:

- Mardia test of skewness: When the sample is drawn from a population with a multivariate normal distribution (null hypothesis), the test statistic is in the form of (Mardia, 1970):

or with correction of exact moments for groups with smaller numbers (<20) (Mardia, 1974):

This statistic has asymptotically (for large numbers) Chi-square distribution with  degrees of freedom.
- Mardia test of kurtosis: When the sample is drawn from a population with a multivariate normal distribution (null hypothesis), the test statistic is in the form of (Mardia, 1974):

or with correction (Mardia, 1974)

This statistic has asymptotically (for large numbers) normal distribution.
The p-value, designated on the basis of the test statistic, for both tests i.e. of the skewness test and the kurtosis test, are compared with the significance level  :
:

Jarque-Bera test for multivariate normality
Jarque and Bera's (1987) 5) test is based on the skewness and kurtosis statistics of the Mardia test. The test statistic is in the form of:

or with correction (Mardia, 1974)

This statistic has asymptotically (for large numbers) Chi-square distribution with  degrees of freedom.
The p-value, designated on the basis of the test statistic, is compared with the significance level  :
:

Hanusz-Tarasinska test for multivariate normality
Zofia Hanusz and Joanna Tarasinska's (2014) 6) test is based on the skewness and kurtosis statistics of the Mardia test. The test statistic is in the form of:

The test statistic has t-Student distribution with  degrees of freedom.
The p-value, designated on the basis of the test statistic, is compared with the significance level  :
:

Henze-Zirkler test for multivariate normality
Henze and Zirkler (1990) 7) proposed a test to examine multivariate normality of the distribution extending the work of Baringhaus and Henze on the empirical characteristic function 8). In the literature, this test is considered one of the strongest tests dedicated to multivariate normal distribution (Thode 2002) 9). The test statistic has the form:

 and
and  are indicator functions that depend on the singularities of the covariance matrix,


 - optimum parameter value
The statistic  has an asymptotically (for large sizes) normal distribution based on the mean and variance described by Henze and Zirkler and read one-sided.
The p-value, designated on the basis of the test statistic, is compared with the significance level  :
:

We examine the normality of the distribution for the classical data set of R.A. Fisher 1936 10). The file can be found in the manual included with the program and contains measurements of the length and width of the petals and calyx sepals for 3 varieties of iris flower. The analysis will be performed separately for each variety.
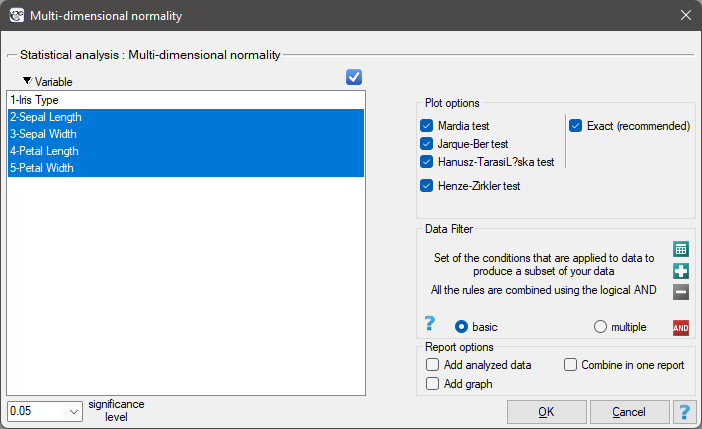
In the analysis window, select all tests and the graph, and set a multiple filter to repeat the analysis for each variety of iris. All the results will be returned to the same datasheet, so select Combine into one report.

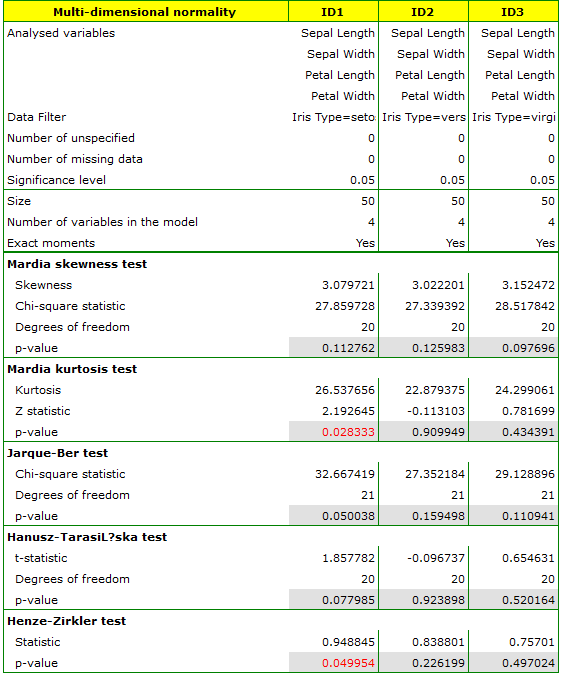
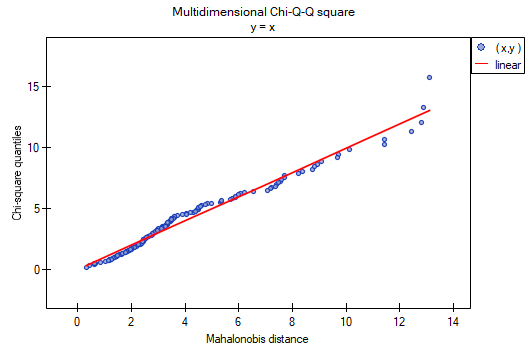
All tests confirm the normality of the distribution for the versicolor and virginica varieties. For the setosa cultivar, the test results are on the verge of statistical significance, with the Mardia test for Kurtosis and the Henze-Zirkler test indicating deviations from the multivariate normal distribution. We can observe such deviations also in the first graph, where as the Mahalanobis distance increases, the points are further and further from the straight line.
