Sensitivity testing
The overall effect of a study may change depending on which studies we include and which we exclude from the analysis. It is the responsibility of the researcher to check how sensitive the analysis is to changes in study selection criteria. Checking for sensitivity helps determine the changes in overall effect resulting from removing a particular study. The studies should be close enough that removing one of them does not completely change the interpretation of the overall effect.
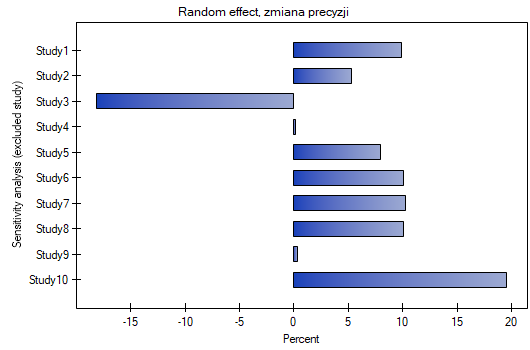
The assigned value remaining contribution defines the percentage that the total weight of the remaining studies in the analysis represents when a given study is excluded. In contrast, the precision chenge indicates how the precision of the overall effect (the width of the confidence interval) will change when a given study is excluded from the analysis.
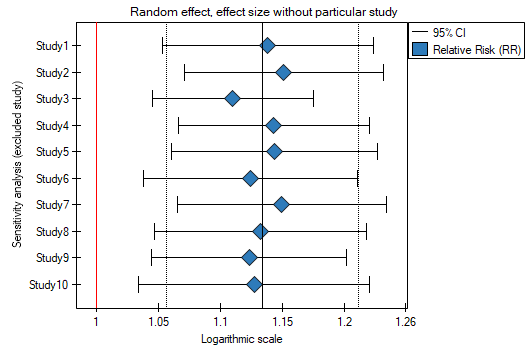
A good illustration of the sensitivity analysis is a forest plot of the effect size and a plot of the change in precision, with each study excluded.
EXAMPLE cont. (MetaAnalysisRR.pqs file)
When examining the effect of cigarette smoking on the onset of disease X, the sensitivity of the analysis was checked to exclude individual studies. To do this, the Sensitivity option was selected in the analysis window and forest plot (sensitivity) and bar plot (sensitivity) were selected..

The overall relative risk, however, not including particular, indicated studies, still remain statistically significant. The only caveat is study 3. When it is excluded, the precision of the summary obtained increases. The confidence interval for the overall effect is then narrower by about 18\%.


Analysis of the plots leads to the same conclusion. The narrowest interval and the most beneficial change in precision will be obtained when test 3 is excluded.