Settings

General settings regarding program options, data sheets, carrying out analysis, returned reports and use of external tools can be changed by selecting menu Edit→Settings.
Program options
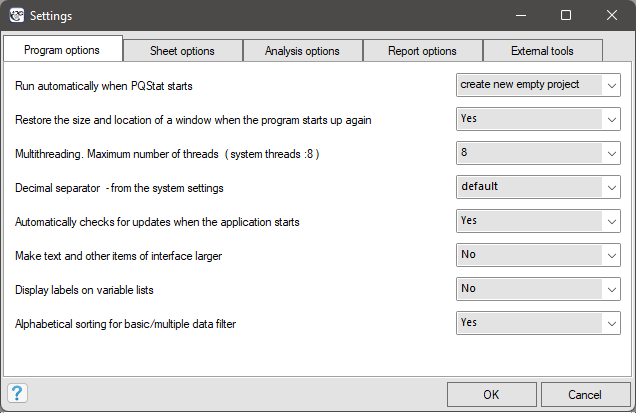
Run automatically when PQStat starts- allows for one of three things to happen when starting the program : open a new project, open a recently used project, or do nothing.Restore the size end location of a window when the program starts up again- allows you to start the program so that its window is in the same place and is of the same size of the last window displayed immediately before closing the program.Multithreading. Maximum number of threads (system threads: 8)- provides the ability to execute tasks in multiple threads simultaneously (up to a maximum of eight threads).SDecimal separator - from the system settings- can be set as comma or period, or by default chosen according to the settings of the operating system the program is running on.Automatiocally checks for updates when the aplication starts- gives you the option to check for and consequently install updates or to opt out of this service.Make tekst and other items of interface larger- allows you to increase the font size and the size of other interface elements, which will reduce the amount of information displayed but may make it easier to readDisplay Labels on variable lists- Gives the option to display the labels of the variables (long names of the variables) in the variables selection lists or as a hint to the names displayed in those lists. This option will have the desired effect if the names of the variables have assigned labels
Sheet options
Maximum number of undo steps in sheet- the number of possible actions you can undo in the worksheet - it affects the speed of the program, so the recommended number is 10.The maximum number of cells to remember in one step- the number of worksheet cells, the simultaneous change of which can be considered as one action to be remembered by the programme. It affects the speed of the program therefore the recommended number of cells is 5000.Sheet font- allows you to set the font type that will be used to display the data contained in the datasheet.Action for duble-click column header- allows you to set what happens after double-clicking the column header. This can be: adjusting the columns width to fit the data inside, opening theCode/Label/Formatwindow, opening theInspectionwindow.
Analysis options
Default significance level for testing- gives the option to change the 0.05 significance level proposed as a standard in statistical analysis windows.MachineEpsilon- information about setting the Epsilon machine size or calculation precision (1E-16).Measure kurtosis- information about the setting of the kurtosis calculation method (g2, or Pearson's b2), where a normal distribution is characterized by value zero of kurtosis g2 or b2 close to the value of three.Sorting order for the contingency tables- gives you the option to sort rows and columns of a contingency table in ascending or descending order. This option not only affects the displayed results in tables and graphs, but also affects those analyses based on contingency tables for which the order of categories is important.Method to sort string values in alphabetical order- Allows you to sort data and results stored in text form naturally or alphabetically. Natural sort order is an improved alphabetical order, where multi-digit numbers are treated indivisibly, i.e. as if they were a single character. For example, in alphabetical sorting, „a11” will be sorted before „a2” because „1” is less than „2”, whereas in natural sorting, „a2” is sorted before „a11” because „2” as less than „11”Labels for values. Show in analysis:- gives you the choice of displaying in values or labels corresponding to current values when using the filter or when the analysis requires setting individual values of the selected variable.
Report options
Displays a value rounded to the specified number of decimal places- allows you to set the maximum number of decimal places reported for real numbers.Displays a percentage rounded to the specified number of decimal places- allows you to set the maximum number of decimal places reported percentages.Exponential notation for p-value- allows you to specify how the p-values of statistical tests are displayed in numeric form (with a defined number of decimal places) or in scientific notation.Color for p-value below the significance level- allows you to set the color that will be used to indicate statistically significant results at the set level.Report name in the navigation tree- gives a choice of the type of information about executed analyses added to the name of analysis in navigation tree. It is possible to give only the name of the test or the name together with: the time of its execution or the description of the test, or the chosen filter, or the used grouping variable, or the names of the variables involved in the analysis.Show variable values as item labels- Gives the option to display the labels of the variables (long names of the variables) in analysis reports. This option will have the desired effect when the names of the variables have assigned labels.Report font- allows you to set the font that will be used to display the result descriptions included in the reports.Default plot size(width/height)- allows you to set the default number of pixels for the height and for the width of the graph.Default plot temlates- gives you the ability to pre-set chart options that are important to user.
External tools
Path to gnuplot binary files- To be able to generate a 3D plot for the analysis of a nuclear 2D density estimator, the gnuplot program must be installed on the system. For more information, see http://sourceforge.net/projects/gnuplot/files/gnuplot/Path to IO module for SPSS Statistics- To be able to read sav files (IBM SPSS Statistics program data storage format), the IBM IO SPSS vendor module is required, so you have to download the IO_Module_for_SPSS_Statistics_20001.zip.