Testing hypotheses
Verification of statistical hypotheses is checking certain assumptions formulated for parameters of a general population on the basis of results from a sample.
Formulation of hypotheses which will be verified with the help of statistical tests.
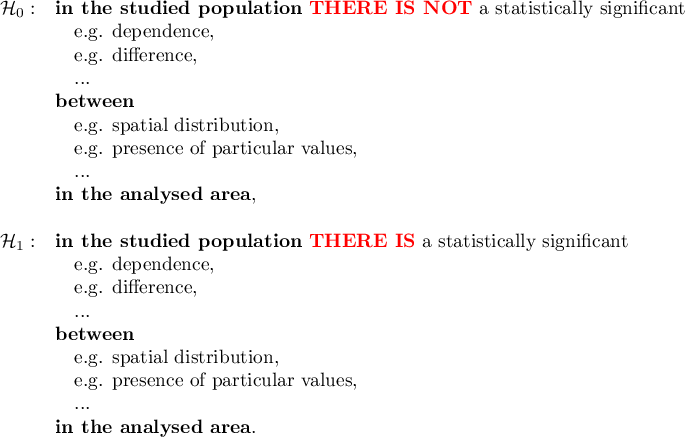
Each statistical test gives the general form of a null hypothesis –  and of an alternative hypothesis –
  :
:

Example:

If we do not know if the distribution of the shops can be more regular than random distribution, or the other way round – more clustered than random distribution, then the alternative hypothesis should be two-sided, i.e. we do not presume a particular direction:

It may happen (in very rare cases) that we are certain that we know the direction in the alternative hypothesis. We can then utilize a one-sided alternative hypothesis.
Hypothesis Verification
To check which of the hypotheses,  or
or  , is more probable, we select a proper statistical test.
Test statistic of a chosen test, calculated according to its formula, is subjected to the theoretical distribution appropriate for that statistic.
![LaTeX \psset{xunit=1.25cm,yunit=10cm}
\begin{pspicture}(-5,-0.1)(5,.5)
\psline{->}(-4,0)(4.5,0)
\psTDist[linecolor=green,nue=4]{-4}{4}
\pscustom[fillstyle=solid,fillcolor=cyan!30]{%
\psTDist[linewidth=1pt,nue=4]{-4}{-2.776445}%
\psline(-2.776445,0)(-4,0)}
\pscustom[fillstyle=solid,fillcolor=cyan!30]{%
\psline(2.776445,0)(2.776445,0)%
\psTDist[linewidth=1pt,nue=4]{2.776445}{4}%
\psline(4,0)(2.776445,0)}
\rput(-3.6,0.2){$\alpha/2$}
\psline{->}(-3.6,0.15)(-3.1,0.04)
\rput(3.6,0.2){$\alpha/2$}
\psline{->}(3.6,0.15)(3,0.04)
\rput(1,0.5){$1-\alpha$}
\psline{->}(1,0.46)(0.55,0.35)
\rput(2.5,-0.04){value of test statistic}
\end{pspicture}](/lib/exe/fetch.php?media=wiki:latex:/img9f31db650e420c91ae61c8b7b9d17550.png)
The program calculates the value of a test statistic and  -value for that statistic (that is the part of the area under the curve which corresponds to the value of the test statistic). Value
  allows to choose which hypothesis, the null hypothesis or the alternative hypothesis, is more probable. The truth of the null hypothesis is always presumed and the proofs gathered in the data are to provide a sufficient number of arguments against that hypothesis:

Usually, significance level  is chosen with the acceptance of the premise that in 5\% of situations the null hypothesis will be rejected being a true one. In special cases a different significance level, e.g. 0.01 or 0.001, can be set.